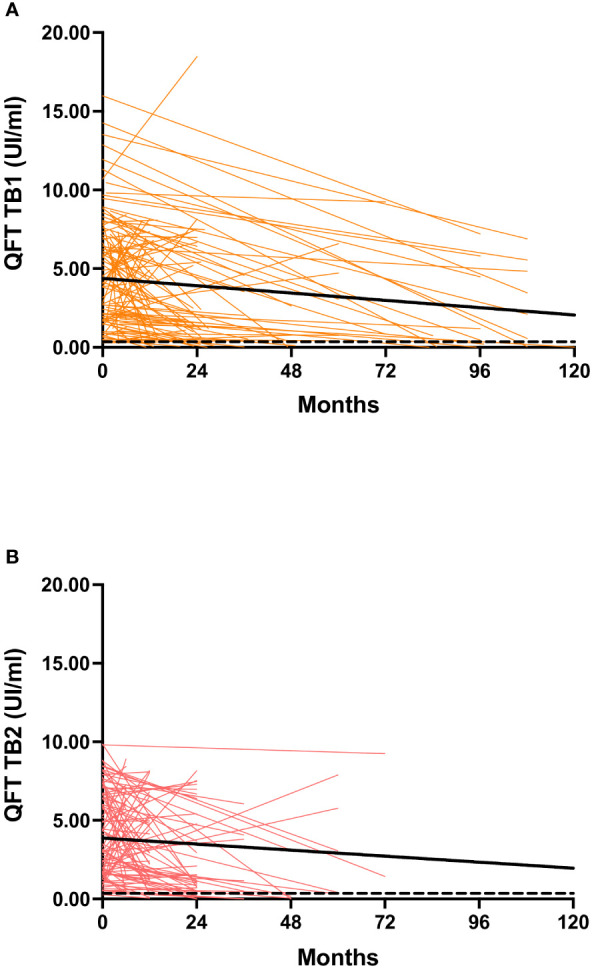
Figure 2.

Background-corrected IFN-γ levels at baseline and during follow-up in the study population. (A) QFT-Plus TB1 tube; (B) QFT-Plus TB2 tube. Bold lines represent the medians; the dashed line indicates the threshold of positivity (0.35 IU/mL) according to the manufacturer. QFT: QuantiFERON-TB; IU: international units. Trendline was made using the least square regression method.
