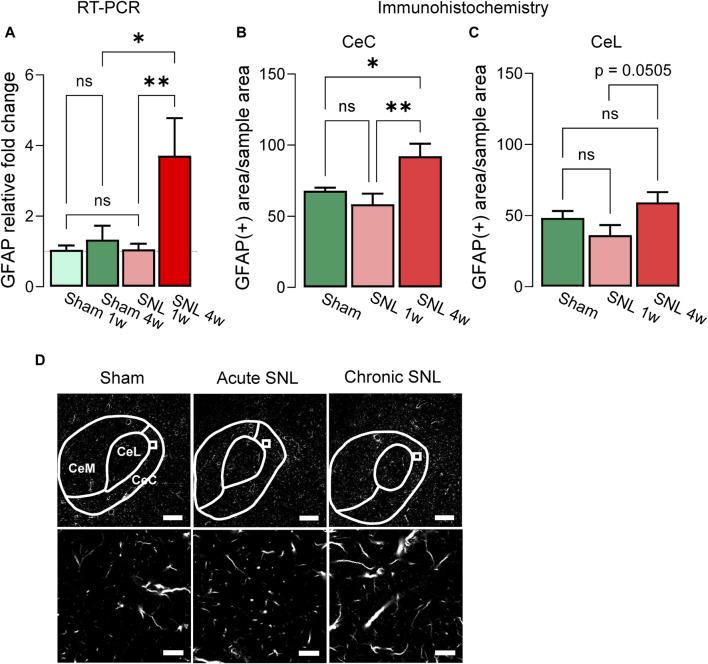
FIGURE 1.
Temporal changes of GFAP mRNA and protein in the CeA of neuropathic rats. (A) Increased GFAP mRNA expression levels in the right CeA 4 weeks, but not 1 week, post-induction of SNL compared to sham control group. Importantly, no significant differences were observed between the two sham control groups (sham 1w vs. sham 4w). Bar histograms show means ± SEM. *,**p < 0.05, 0.01, two-way ANOVA with Bonferroni posthoc tests. Sham 1w, n = 7; sham 4w, n = 4; SNL 1w, n = 7; SNL 4w, n = 4. (B) Immunohistochemistry shows significantly increased GFAP (+) signal in CeC of chronic SNL rats compared to acute SNL or sham groups. A similar trend was detected in the CeL (C) though no statistical significance was reached (p = 0.0505). (D) Representative images of GFAP (+) signal in the CeA of different treatment groups. Bottom: representative sample area used for analysis. Scale bars, top, 200 μm; bottom, 10 μm *, **, p < 0.05, 0.01, one-way ANOVA Tukey’s posthoc tests. CeC and CeL: sham, n = 10, SNL 1w, n = 10, SNL 4w, n = 10 sections from three animals per group.

