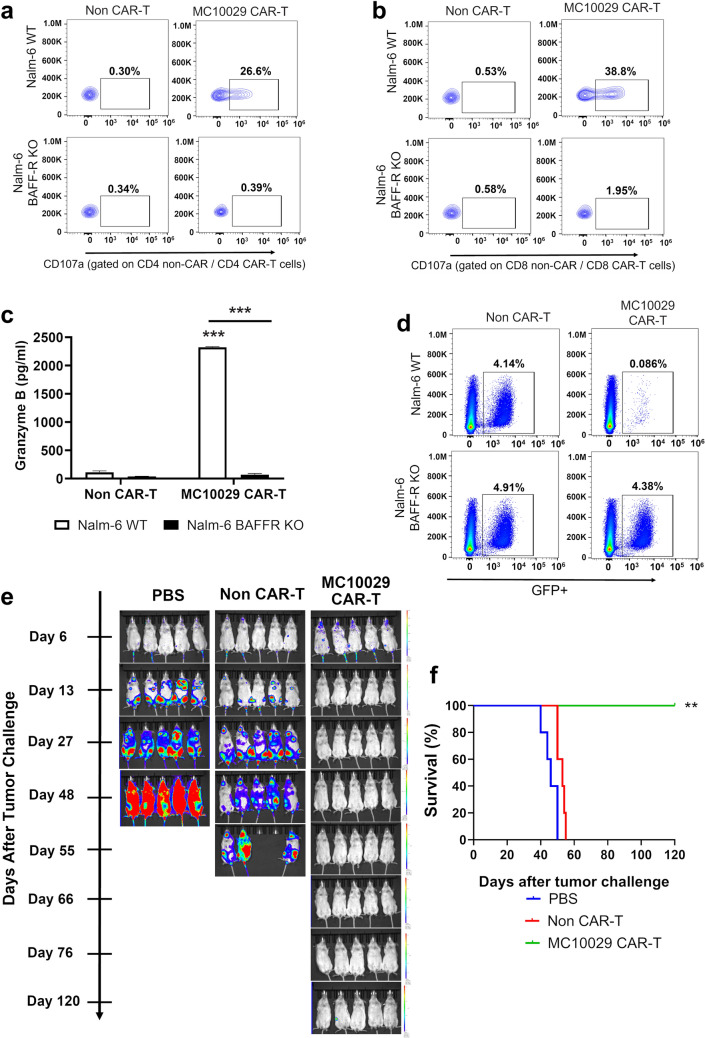
Fig. 1.
Antigen-specific cytotoxicity of MC10029 CAR-T cells against acute lymphocytic leukemia (ALL) cell lines in in vitro and in vivo models. a, b Flow cytometry contour plots of CAR T-cell functional potency, as measured by the surface expression of CD107a in a degranulation assay. MC10029 CAR-T cells were incubated with Nalm-6 WT or Nalm-6 BAFF-R KO cells at an E:T ratio of 2:1. Analysis was gated on CD4 + CAR-T cells (a) or gated on CD8 + CAR-T cells (b); gating on EGFR was used as a proxy for CAR expression in the CAR-T cells. Non-transduced T cells (Non-CAR-T) from the same donor were used as negative controls. (Statistical analysis, Supplementary Fig. 7a/b). c Granzyme B ELISA further confirmed the antigen-specific potency of MC10029 CAR-T cells against Nalm-6 cells. Non-CAR-T or MC10029 CAR-T cells generated from the same donor were co-incubated with either Nalm-6 WT or Nalm-6-BAFF-R KO cells at an E:T ratio of 4:1. After 72 h, the supernatants were collected and assayed in a granzyme B ELISA. Graphed data are means of quadruplicate sampling. The results shown are representative of three independent experiments. d Direct target cell cytolysis was measured by incubating GFP expressing Nalm-6 cells with CAR-T cells. Non-CAR-T cells or MC10029 CAR-T cells were co-incubated with either Nalm-6 WT or Nalm-6 BAFF-R KO cells at an E:T ratio of 20:1 for 24 h, followed by flow cytometry to quantify the GFP expression target cells. The results shown are representative from three independent experiments. e The in vivo therapeutic efficacy of MC10029 CAR-T cells was evaluated in an NSG mouse model in which the mice were challenged with luciferase labeled Nalm-6 tumor cells (0.25 × 10⁶ cells/mouse). Bioluminescent imaging catalogs the changes of luciferase-expressing Nalm-6 tumors. Six days after tumor cell injection, tumor-bearing mice were randomized into three groups (N = 5 per group) to receive a single intravenous (IV) infusion of either vehicle (PBS), non-CAR T cells (10 × 106 total T cells), or MC10029 CAR-T cells (2 × 10⁶ CAR-T cells out of 10 × 10.6 total T cells) that were generated from the same donor. Although imaged weekly, we share representative images along the time course to highlight changes due to treatment. These data are the representative of two independent experiments using different donor T cells. f A Kaplan–Meier plot of overall survival versus days after tumor challenge details the overall survival of the three treatment groups; log rank analysis identified statistical differences between the treatment groups. (**p < 0.01; ***p < 0.001)

