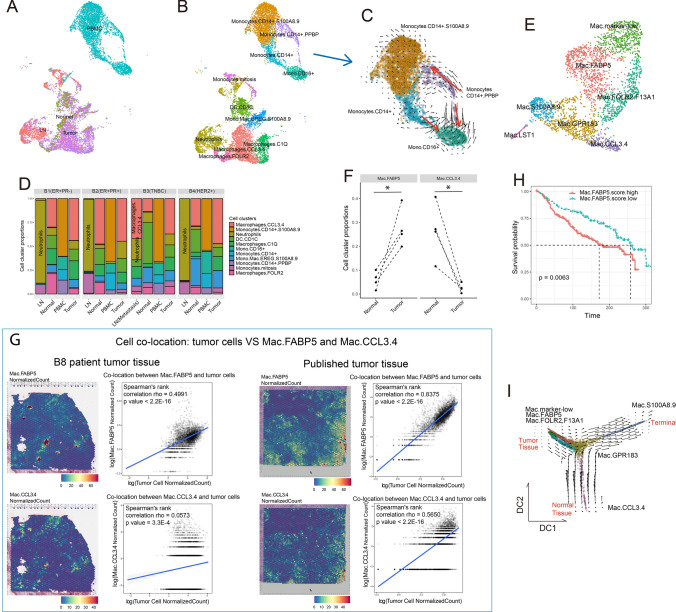
Fig. 2.
Myeloid cells exhibited microenvironment-dependent plasticity and showed clinical outcome relevance. A UMAP visualization of myeloid cell distributions based on histologic origin. B UMAP visualization of myeloid cell subtypes. C Velocity plot of the UMAP of monocytes from PBMCs. D Histogram of myeloid subtype compositions in the four patients. E UMAP visualization of LN- and tissue-infiltrated macrophage subtypes. F Paired dot plot showing cell cluster proportions between normal and tumor tissue in the four patients. G Spatial heatmaps and dotplots showing the cell colocations of tumor cells and the two groups of macrophages in tumor tissue. Cell colocation scores were estimated by Spearman correlation of normalized scores of corresponding cell groups. H Survival plot of patients from METABRIC based on Mac.FABP5 signature gene scores. I Velocity plot on the diffusion map of LN- and tissue-infiltrated macrophages

