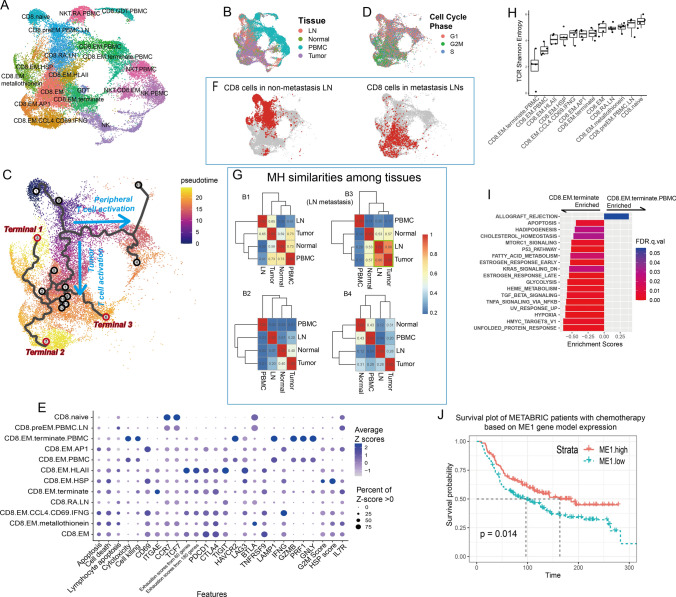
Fig. 3.
Cytotoxic cell heterogeneity. A UMAP visualization of cytotoxic cell subgroups. B UMAP visualization of cytotoxic cells labeled by histologic origin. C Pseudotime trajectories on UMAP. D UMAP visualization of cytotoxic cells labeled by cell cycle phases. E Dot plot of features from CD8 + T cell subgroups. Pathway signature genes were collected from REACTOME. Gene scores were calculated based on the expression of the top 30 positively correlated genes. F UMAP visualization of CD8 + T cells in nonmetastatic and metastatic LNs. G Heatmaps of CD8 + cell MH similarities among tissues. H Boxplot of TCR Shannon entropy in each CD8 + subgroup. I Hallmark pathway enrichment plot comparing two CD8 + terminal effector cell groups. J Survival plot of METABRIC patients with chemotherapy based on ME1 gene model expression

