Fig. 4.
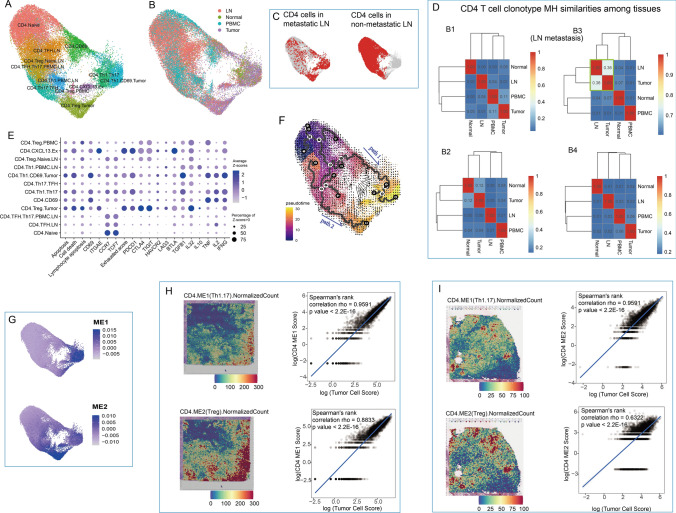
CD4+ T cell heterogeneity. A UMAP visualization of CD4+ T cell subgroups. B UMAP visualization of CD4+ T cells labeled by histologic origin. C UMAP visualization of CD4+ T cells in metastatic and nonmetastatic LNs. D Heatmaps of CD4 T cell clonotype MH similarities among tissues in B1-4 patients. E Dot plot of features from CD4 T cell subgroups. Pathway signature genes were collected from REACTOME. Gene scores were calculated based on expressions from top 30 positively correlated genes. F Cell differentiation path on UMAP combined by RNA velocity and pseudotime trajectories. G UMAP visualization of two gene model scores generated by WGCNA. Cell colocations between tumor cells and two groups of CD4 cells in tumor tissue in published data (H) and B8 patient (I). Cell colocation scores were estimated by Spearmen correlation of normalized scores of corresponding cell groups

