Fig. 5.
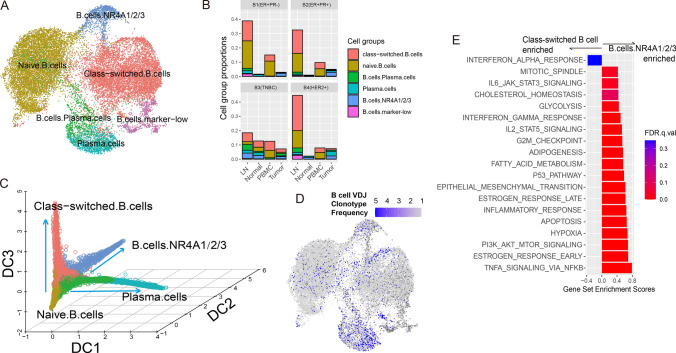
B cell heterogeneity. A UMAP visualization of B cell subgroups. B Proportion B cell subgroups under total cells in related tissues from four patients. C Diffusion map 3D visualization showing B cell differentiation paths. D UMAP visualization of B cell clonotype frequency. E Hallmark pathway enrichment plot comparing two B cell subgroups

