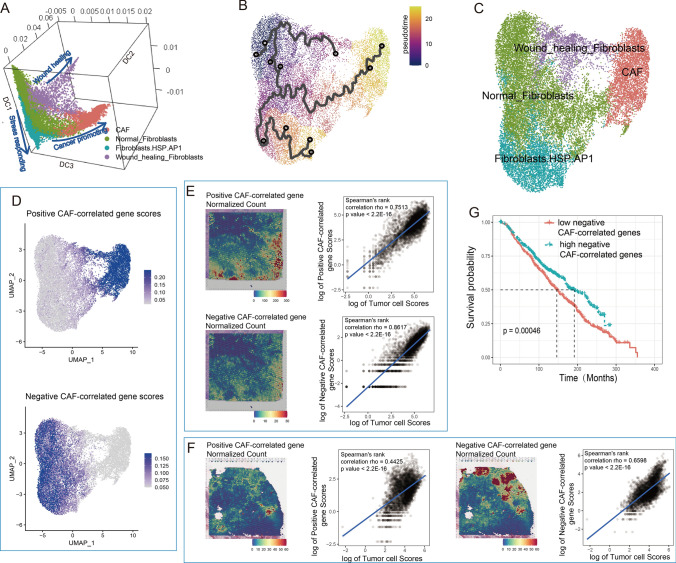
Fig. 6.
Fibroblast heterogeneity. A UMAP visualization of fibroblast subgroups. B Diffusion map 3D visualization showing fibroblast differentiation paths. C Pseudotime trajectory of fibroblast differentiation. D UMAP visualization of expression scores from positively and negatively correlated genes along with CAF development. Spatial heatmaps and dotplots showed cell colocations between tumor cells and two groups of CD4 + cells in tumor tissue in published data (E) and B8 patient (F). Cell colocation scores were estimated by Spearman correlation of normalized scores of corresponding cell groups. G Survival plot of METABRIC patients based on negative CAF-correlated gene scores

