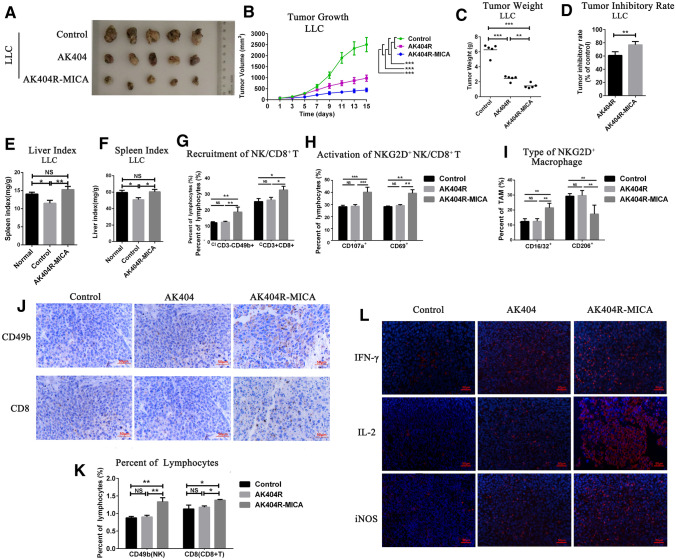
Fig. 6.
AK404R-MICA showed superior anti-tumor efficacy in LLC model in vivo through recruiting and activating immune cells and inducing the polarization of macrophages to M1 type. A, tumor images of each group under different treatments after 15d. B, growth curves of tumors. C, the average tumor weights of different groups. D, Tumor inhibitory rate of different groups. Data were given as the mean ± SD (n = 5). *p < 0.05, **p < 0.01, ***p < 0.001. E, F, the liver index and spleen index of AK404R-MICA compared with normal mice. Liver index/spleen index (mg/g) = Liver/Spleen weight (mg)/Mice weight (g). G, H, quantitative analysis of recruitment and activation of NKG2D+ NK (CD3−CD49b+CD107a+) cells and T (CD3+CD8+CD69+) cells. I, quantitative analysis of polarization of NKG2D+ macrophage cells to M1 (F4/80+CD16/32+) phenotype or M2 (F4/80+CD206+) phenotype. J, IHC staining of CD49b and CD8 on paraffin sections that represents NK cells and CD8+ T cells in LLC xenografted tumors. Positive cells were identified with antibodies in brown staining. Magnification, × 400. K, semiquantitative and statistical analysis of CD49b+ NK cells and CD8+ T cells. L, immunofluorescence staining to evaluate the levels of IFN-γ, IL-2, and iNOS (red fluorescence) that were released by NK cells, CD8.+ T cells, and macrophage cells. (Green fluorescence) in different groups. Magnification, × 400

