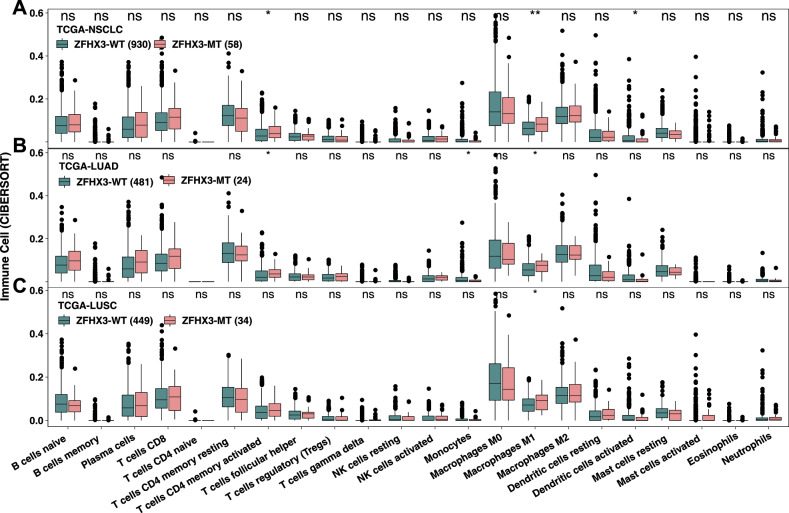
Fig. 4.
Comparison of immune cells between ZFHX3-MT and ZFHX3-WT tumors in the TCGA-NSCLC (a), LUAD (b), and LUSC (c) cohorts. Gene expression profiles were prepared using standard annotation files, and data were uploaded to the CIBERSORT web portal (https://cibersort.stanford.edu/), with the algorithm run using the LM22 signature and 1,000 permutations

