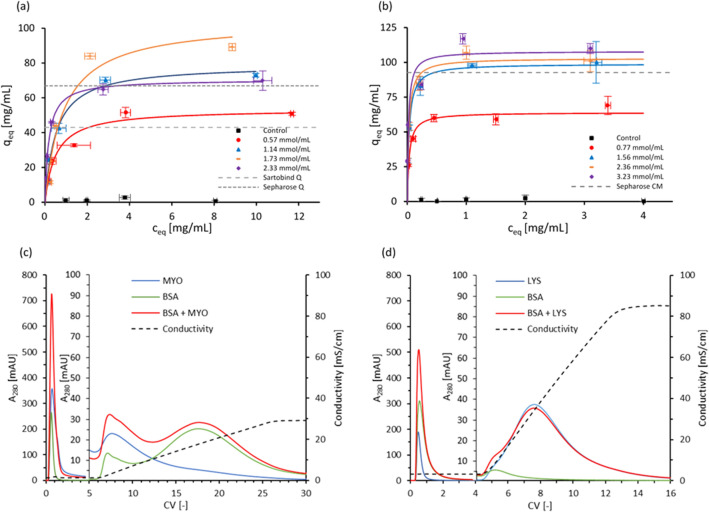
Fig. 2.
Adsorption isotherms of a BSA on anion exchangers (based on AETAC monomer,
adapted from Simon et al. 2020), and b LYS on cation exchangers (based on CEA monomer). Ligand densities of 0 (control), 0.57, 1.14, 1.73, 2.33 mmol/mL and of 0 (control), 0.77, 1.56, 2.36, 3.23 mmol/mL were tested for the anion and cation exchanger, respectively. Isotherms were fitted with Langmuir model (continuous lines). Dashed lines correspond to maximum binding capacity of equivalent commercial materials (Boi et al. 2020; Staby et al., 2005). c Separation of BSA (16 mg/mL) and MYO (6 mg/mL) on AETAC-based anion exchangers (1.6 mL column volume (CV), 1.73 mmol/mL ligand density). 500 μL injection in binding buffer (20 mM Tris, pH 8.0) followed by linear gradient from 0 to 30% elution buffer (20 mM Tris, 1 M NaCl, pH 8.0) over 20 CV at 1.0 mL/min (75 cm/h). First peak is flow through of overloaded BSA and MYO; second and third peaks correspond to MYO elution at 7.4 CV (3.1 mS/cm) and BSA elution at 18.7 CV (19.0 mS/cm) in line with the electrostatic interactions established at the buffer’s pH of 8 (pIBSA = 4.8; pIMYO = 7.0). d Separation of BSA (16 mg/mL) and LYS (4 mg/mL) on CEA-based cation exchangers (2.5 mL CV, 3.23 mmol/mL ligand density). 300 μL injection in binding buffer (25 mM phosphate, pH 7.4) followed by linear gradient from 0 to 100% elution buffer (25 mM phosphate, 1 M NaCl, pH 7.4) over 20 CV at 1.0 mL/min (75 cm/h). First peak is flow through of non-binding BSA (pIBSA = 4.8) and overloaded LYS; second peak corresponds to LYS elution at 7.6 CV (33.4 mS/cm) in line with the electrostatic interactions established at the buffer’s pH of 7.4 (pILYS = 11.4)

