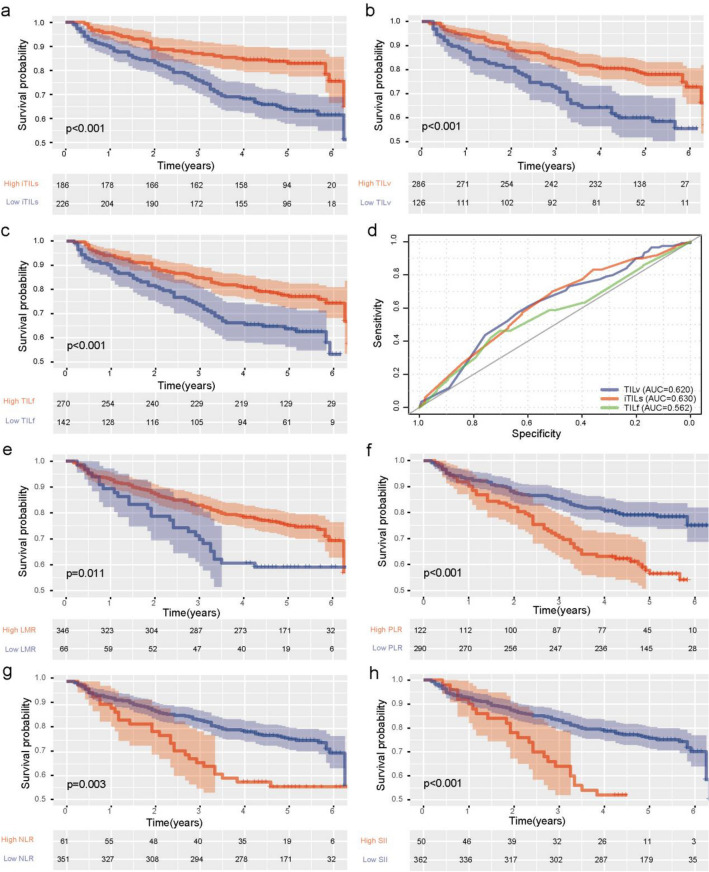
Fig. 1.
Correlation analysis of inflammatory markers and prognosis a, b, c, Kaplan–Meier curves showed that high iTILs(b), fTILs(c), and TILV(d) density correlated with superior OS of patients with LSCC, P-values calculated by log-rank test. d A receiver operating characteristic (ROC) curve analysis for iTILs, TILv and TILf. e, f, g, h Kaplan–Meier curves showed that high LMR (e), low PLR (f),NLR (g), and SII (h)correlated with superior OS of patients with LSCC. P-values calculated by log-rank test

