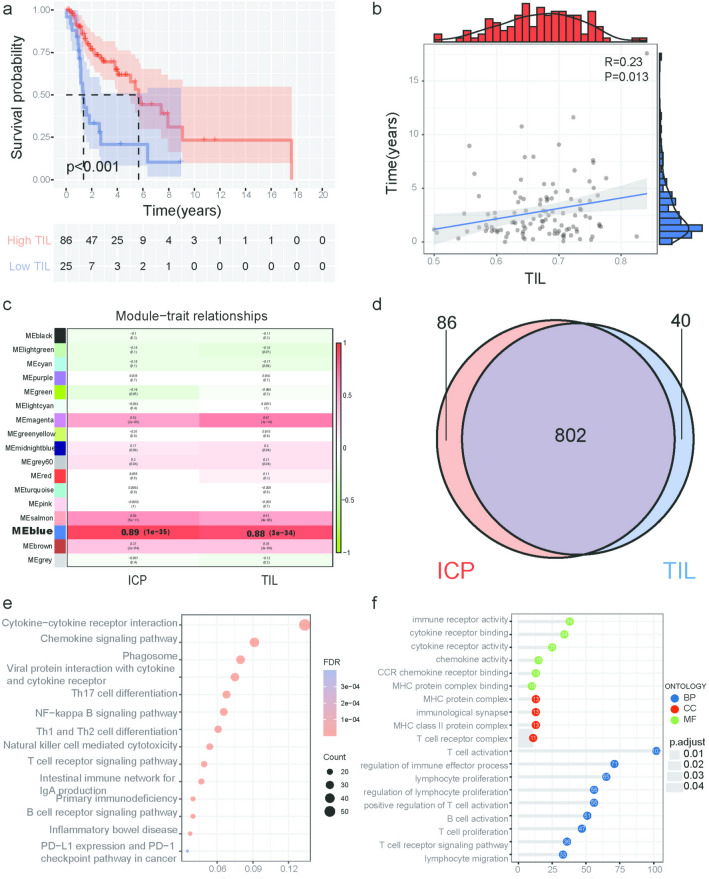
Fig. 2.
Analysis of the prognostic value of TILs and enrichment analysis of TIL-related genes a Patients in the high TILs’ group experienced a longer survival time, tested by the Kaplan–Meier test. b The survival time of patients with LSCC longer as the TILs increased (R = 0.23, P = 0.013). c Module–trait associations. Each row corresponds to a module, and each column corresponds to a trait. Each cell contains the corresponding correlation and P value. The table is color-coded by correlation according to the color legend. d The Venn diagram was used to extract the intersection of ICP and TIL-related genes, and 802 common genes were obtained. e The genes involved in the blue module were analyzed by KEGG. The node size reflects the gene count, and the node color reflects the P value. f Gene Ontology analysis of the genes involved in the blue module regarding biological process, cellular component, and molecular function

