Fig. 6.
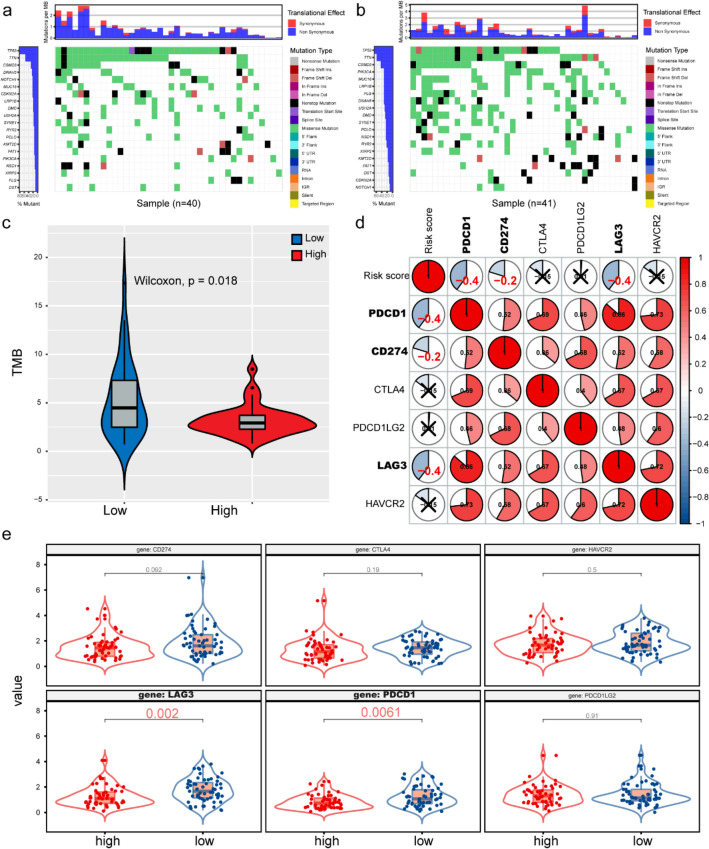
The relationship between WGCNA-Genes signature and immunotherapy a, b Gene mutations in high- and low-risk groups in LSCC samples. c The Wilcoxon rank-sum test was used to compare differences in TMB between low- and high-risk groups. P < 0.05. d Spearman's correlation coefficients were computed to investigate the potential relationship between immune checkpoints and risk score. (Red represents a positive correlation and blue represents a negative correlation). e Different expressions of ICIs between risk groups defined by the WGCNA-genes signature. LAG3 and PDCD1 were overexpressed in the low-risk group (all P < 0.05)

