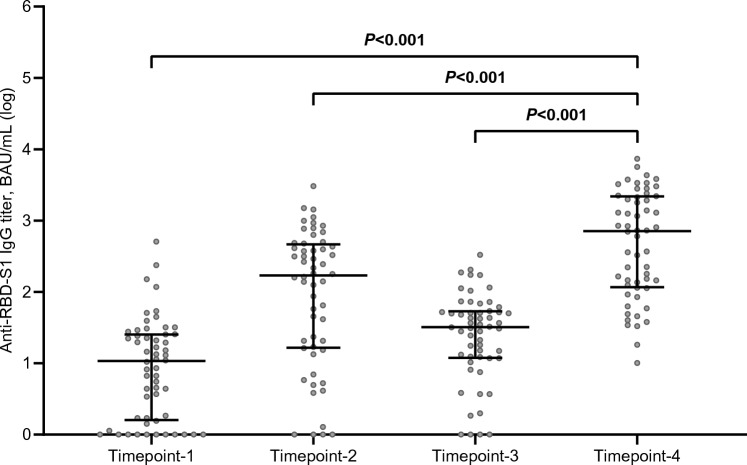
Fig. 1.
Longitudinal comparison of scatter plot distributions and medians of antibody titers. RBD-S1 receptor-binding domain (RBD) of the SARS-CoV-2 Spike protein (S1), BAU binding antibody unit; log, logarithmic values. Bars represent median values with interquartile range; timepoint-1 denotes assessment 3 weeks after the first dose of tozinameran; timepoint-2 denotes assessment 8 weeks after the second dose of tozinameran; timepoint-3 denotes assessment before the third dose of tozinameran; timepoint-4 denotes assessment 4 weeks after the third dose of tozinameran

