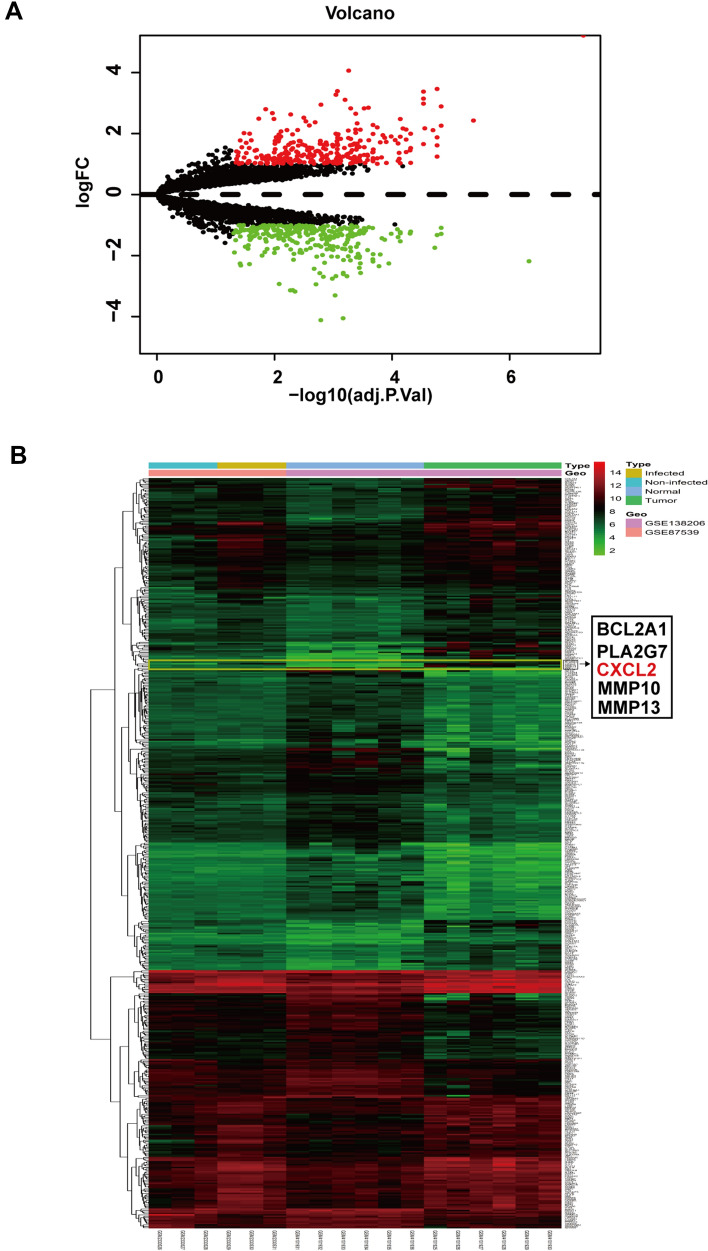
Fig. 1.
DEGs identified in GSE138206 and GSE87539. Volcano map of DEGs between P. gingivalis-infected OSCC samples and uninfected normal oral mucosa samples. a The red points in the volcano plots represent upregulation and the green plots represent downregulation. b Heatmap of the total DEGs according to the value of |logFC|. The colour in heat map from green to red shows the progression from low expression to high expression

