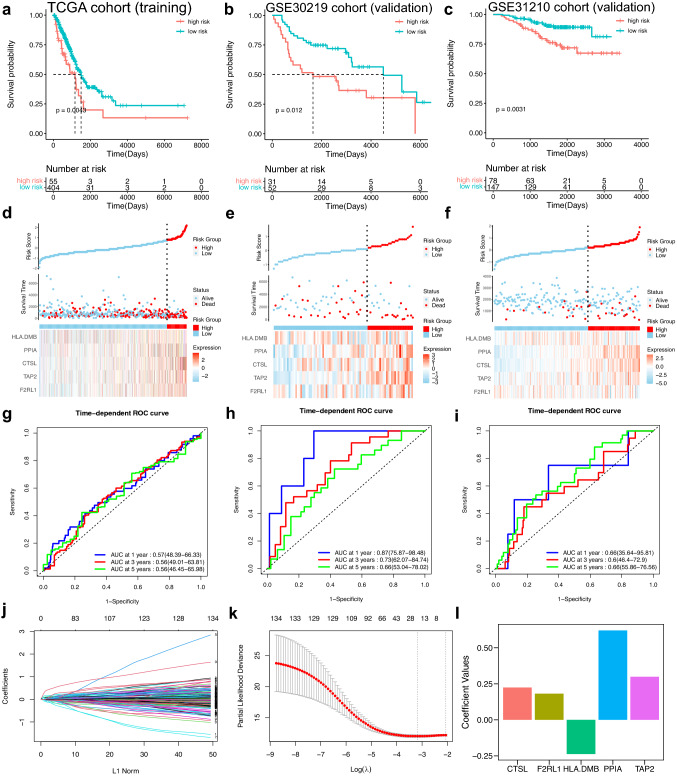
Fig. 3.
Establishment and validation of the IPM. a–c The Kaplan–Meier analysis of the IPM in TCGA cohort, GSE30219 cohort and GSE31210 cohort. d–f The distribution of different risk groups and the heatmap of hub genes in TCGA cohort, GSE30219 cohort and GSE31210 cohort. g–i Time-dependent ROC curves of the IPM in TCGA cohort, GSE30219 cohort and GSE31210 cohort. j–k The process of LASSO Cox analysis. (L) Coefficient values for hub genes

