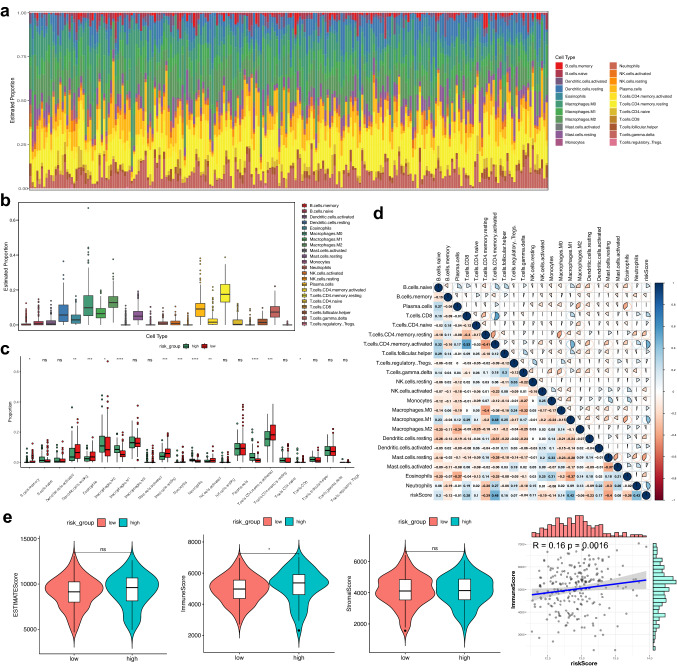
Fig. 6.
Analysis of immune infiltrating cell fractions and immune-related scores between different risk groups. a The proportions of twenty-two immune infiltrating cells. b Boxplots reveal the fractions of the twenty-two immune infiltrating cells. c Boxplots reveal the diverse fractions of immune infiltrating cells between the different risk groups. d Correlation matrix of the immune infiltrating cells and the risk score. e The difference of immune score, ESTIMATE score, stromal score, and tumor purity between different risk groups. Ns: p ≥ 0.05, ∗: p < 0.05, ∗∗ : p < 0.01, ∗∗∗ : p < 0.001

