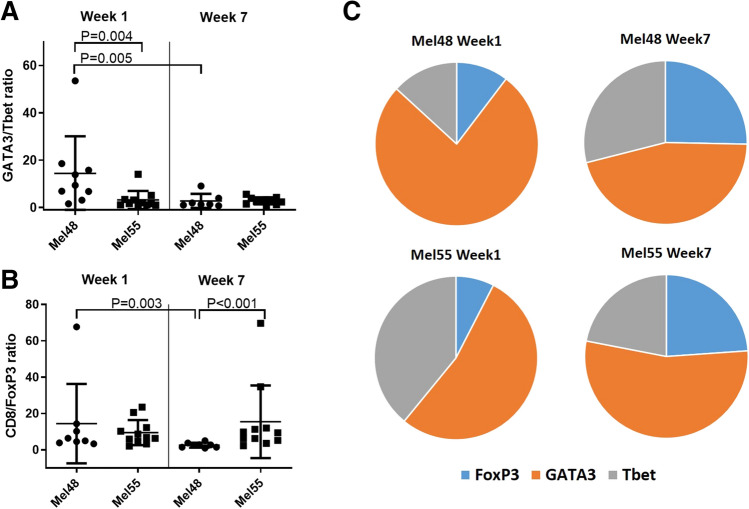
Fig. 4.
a Ratio of GATA3+ cells to Tbet+ cells in the VSME in MEL48 and MEL55 both week 1 and week 7 after the first vaccine. b Ratio of CD8+ cells to FoxP3+ cells in the VSME in MEL48 and MEL55 both week 1 and week 7 after the first vaccine. For panels a and b, means and standard deviations are shown in addition to values for each sample. c Relative proportions of FoxP3+, Tbet+, and GATA3+ cells in the VSME dermis are shown for both trials and both time points. All p values have been corrected for false-discovery rate as stated in the methods and statistical significance was determined at p < 0.005

