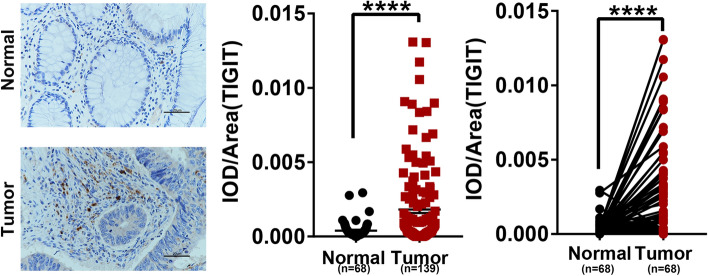
Fig. 2.
The protein expression pattern of TIGIT is different in human colorectal cancer a. Representative IHC staining of TIGIT in human colorectal cancer tissues and adjacent noncancerous tissues. Scale bars: 400 × 20 μm. b. TIGIT protein expression of 139 colorectal cancer tissues and 68 adjacent noncancerous tissues by IHC in tissue paraffin sections. c. Paired comparison of TIGIT protein expression of 68 paired cancer tissues and noncancerous tissues. Error bars represent mean ± SEM. Two-tailed Student’s t test and paired t-test were performed for statistical analysis; ns: not significant; *:p < 0.05; **:p < 0.01; ***:p < 0.001; ****: P < 0.0001

