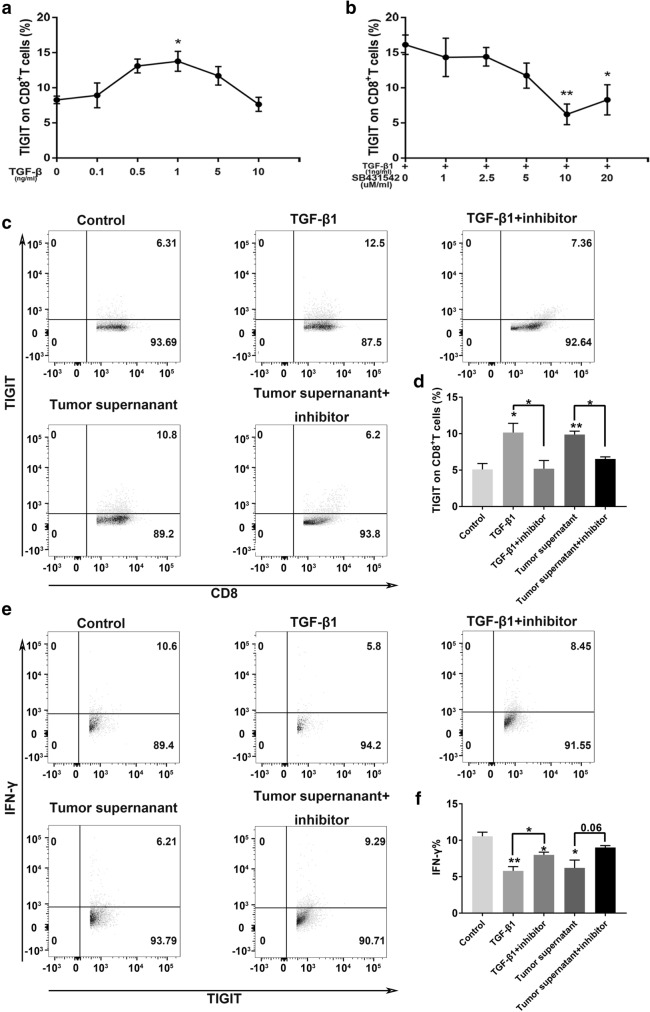
Fig. 5.
Colorectal cancer promotes TIGIT+CD8+T cell expansion via TGF-β1 a. TIGIT expression on CD8+T in different TGF-β1 concentrations. n = 3 biologically independent experiments. b. TIGIT expression on CD8+T in different TGF-β1 inhibitor (SB431542) concentrations with TGF-β1(1 ng/ml). n = 3 biologically independent experiments. c. Representative contour plots for the percentage of TIGIT+CD8+T cells in TGF-β1(1 ng/ml), TGF-β1(1 ng/ml) + inhibitor(10uM/ml), tumor supernatant, and tumor supernatant + inhibitor r(10uM/ml) conditional medium systems. d. Quantification of FACS analysis for the percentage of TIGIT+CD8+T cells. n = 3 biologically independent experiments. e. Representative contour plots for the percentage of IFN-γ+TIGIT+CD8+T cell in TGF-β1(1 ng/ml), TGF-β1(1 ng/ml) + inhibitor(10uM/ml), tumor supernatant, and tumor supernatant + inhibitor r(10uM/ml) conditional medium systems. f. Quantification of FACS analysis for the percentage of IFN-γ+TIGIT+CD8+T cells. n = 3 biologically independent experiments. Error bars represent mean ± SEM. Two-tailed Student’s t test was performed for statistical analysis; ns: not significant; *p < 0.05; **p < 0.01; ***p < 0.001; ****P < 0.0001

