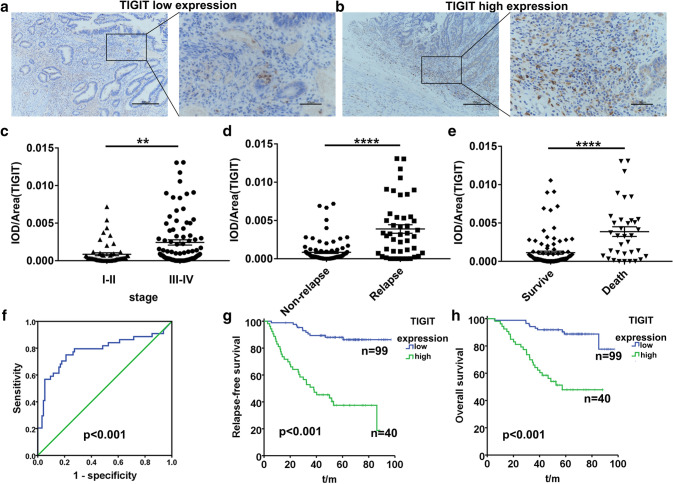
Fig. 6.
Upregulated TIGIT expression is correlated with poor prognosis of colorectal cancer a. Low expression pattern of TIGIT in human colorectal cancer tissues. Scale bars: 100 × 100 μm, 400 × 20 μm. b. High expression pattern of TIGIT in human colorectal cancer tissues. Scale bars: 100 × 100 μm, 400 × 20 μm. c. TIGIT protein expression in stage I–II and stage III–IV colorectal cancer. stage I–II n = 54, stage III–IV n = 85. d. TIGIT protein expression in non-relapse and relapsed colorectal cancer. non-relapse n = 94, relapse n = 45. e. TIGIT protein expression in survival and dead colorectal cancer patients. survival n = 103, dead n = 36. f. ROC of TIGIT expression. Analyzed by the log-rank test. g. Kaplan–Meier analysis of relapse-free survival according to low and high TIGIT protein expression in 139 colorectal cancer patients. h. Kaplan–Meier analysis of overall survival according to low and high TIGIT protein expression in 139 colorectal cancer patients. Error bars represent mean ± SEM. Two-tailed Student’s t test was performed for statistical analysis; ns: not significant; *:p < 0.05; **:p < 0.01; ***:p < 0.001; ****: P < 0.0001

