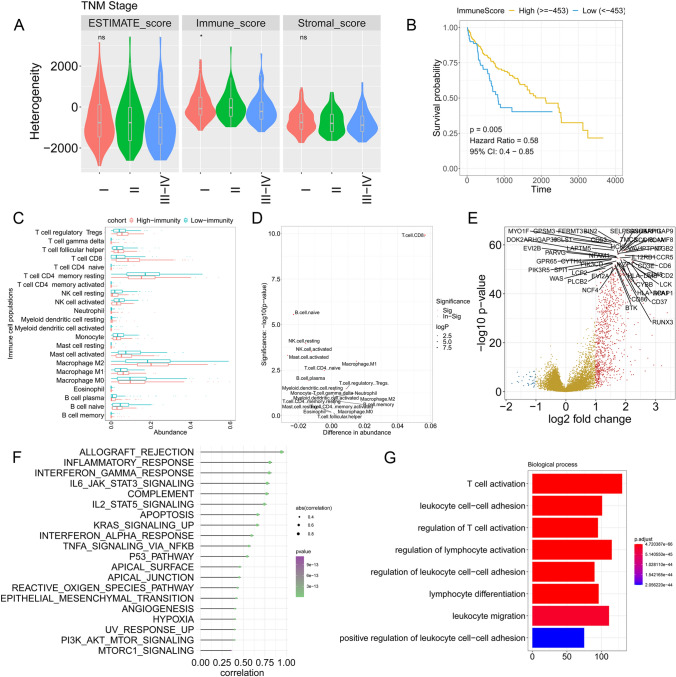
Fig. 1.
Construction of the TME in HCC. a Comparison of the distributions of immune scores between tumours in different TNM stages. b Kaplan–Meier curve showing the association between overall survival and immune scores in HCC patients. c Immune cell population distribution in the high- and low-immunity cohorts. d Statistical analysis of the immune cell population in the high- and low-immunity cohorts. e Volcano plot indicating the DEGs between the high- and low-immunity cohorts. f ssGSEA revealing the association between significant hallmarks and immune score. g GO analysis. The x axis indicates the overlapping numbers between each GO term and DEGs. The colour of the bars represents the adjusted p values (with FDR correction)

