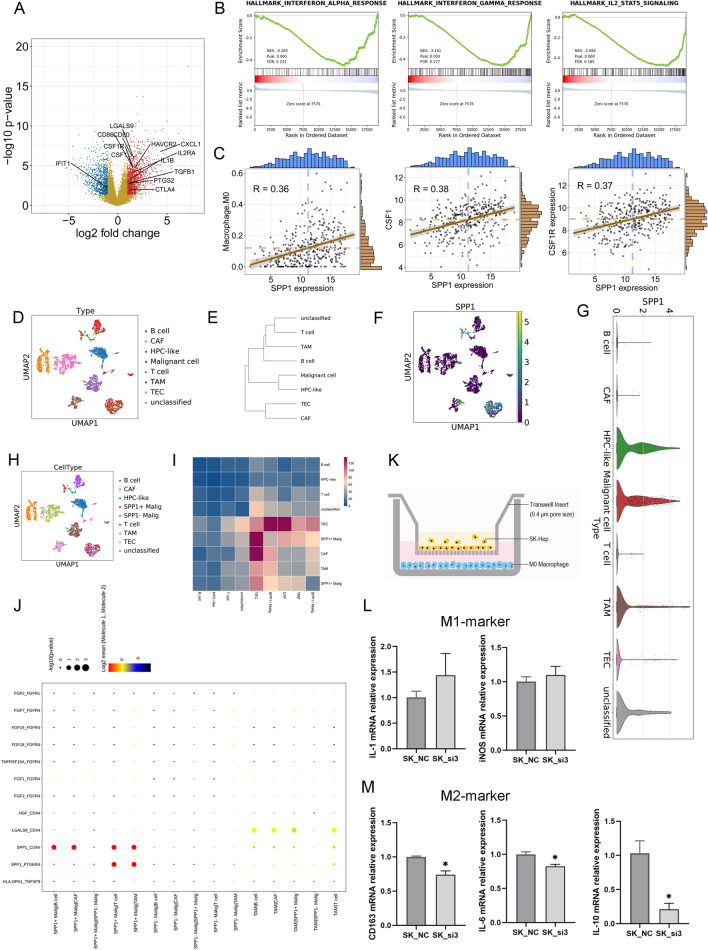
Fig. 6.
Single-cell transcriptome analysis for tumour heterogeneity in HCC patients. a Volcano plot indicating the DEGs between the SPP1 high-expression and SPP1 low-expression groups. B GSEA between the SPP1 high-expression and SPP1 low-expression groups. c Association of M0 macrophage abundance with SPP1, CSF1 and CSF1R expression. d UMAP showing the distribution of various cell types. e Hierarchical clustering of cell types. f UMAP indicating SPP1 expression in different cell types. g UMAP showing the distribution of various cell types, including SPP1 + malignant cells and SPP1-malignant cells. h Histogram showing the expression level of SPP1. i Heatmap indicating the number of LR pairs between different cell types. j Heatmap indicating the ligand-receptor pairs between different cells

