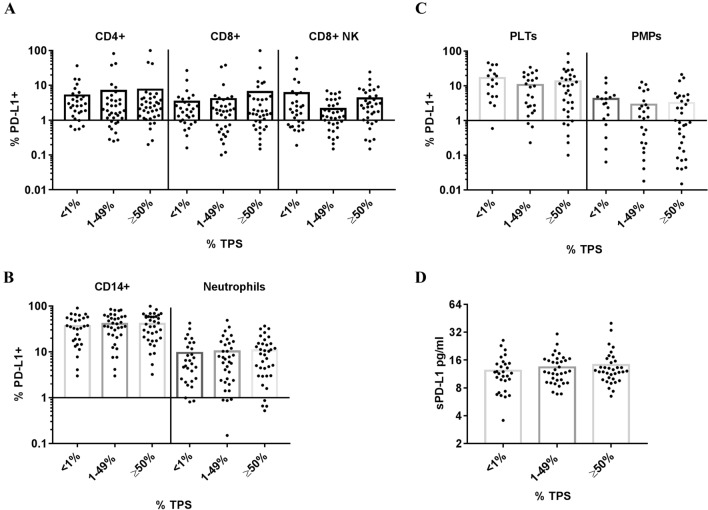
Fig. 2.
Percentage of circulating PD-L1 + leukocytes, PD-L1 + PLTs and PMPs, and plasma sPD-L1 levels according to tumor PD-L1 expression. Dot plots show percentage of a PDL1 + CD4 + , PD-L1 + CD8 + and PD-L1 + CD8 + NK cells (102 patients with NSCLC), b PD-L1 + CD14 + and PD-L1 + Neutrophils (102 patients with NSCLC), c Platelets (PLTs) and platelets microparticles (PMPs) (73 patients with NSCLC) and d plasma soluble PD-L1 (sPD-L1) (101 patients with NSCLC) according to PD-L1 tumor expression (TPS: tumor proportion score)

