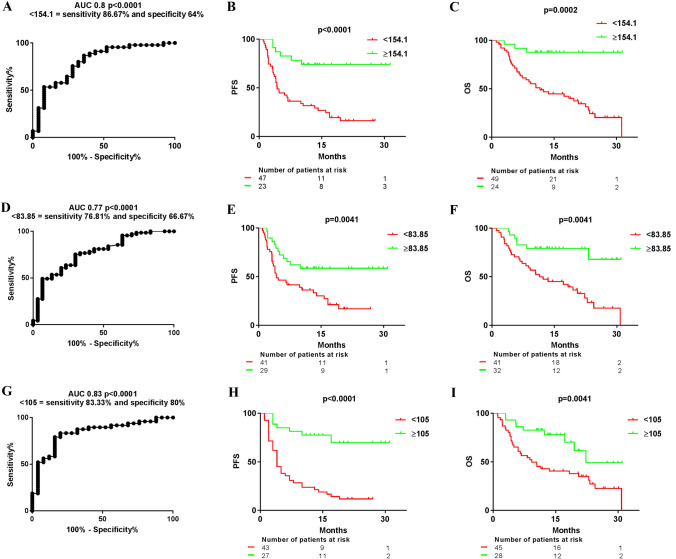
Fig. 5.
Median progression-free survival (PFS) and overall survival (OS) in different groups of patients with NSCLC achieved according to the integration of PD-L1 data (IPD) from different systemic and tumor sources. a ROC curve comparing the integrated PD-L1 data (IPD) from systemic and tumor PD-L1 sources (leukocytes, PLTs and PMPs, sPD-L1 and TPS) from patients with progressive versus non-progressive disease to PD-(L)1 blockade agents to obtain the best cut-off point to discriminate them. b MedianPFS and c median OS according to the cut-off point (154.1). d ROC curve comparing the IPD from PD-L1 + CD14 + and tumor PD-L1 expression from patients with progressive versus non-progressive disease to PD-(L)1 blockade agents. e Median PFS and f median OS according to the cut-off point (83.85). g ROC curve comparing the IPD from PD-L1 + leukocytes, PD-L1 + PLTs and PMPs and plasma sPD-L1 levels from patients with progressive versus non-progressive disease to PD-(L)1 blockade agents. h Median PFS and i median OS according to the cut-off point (105)

