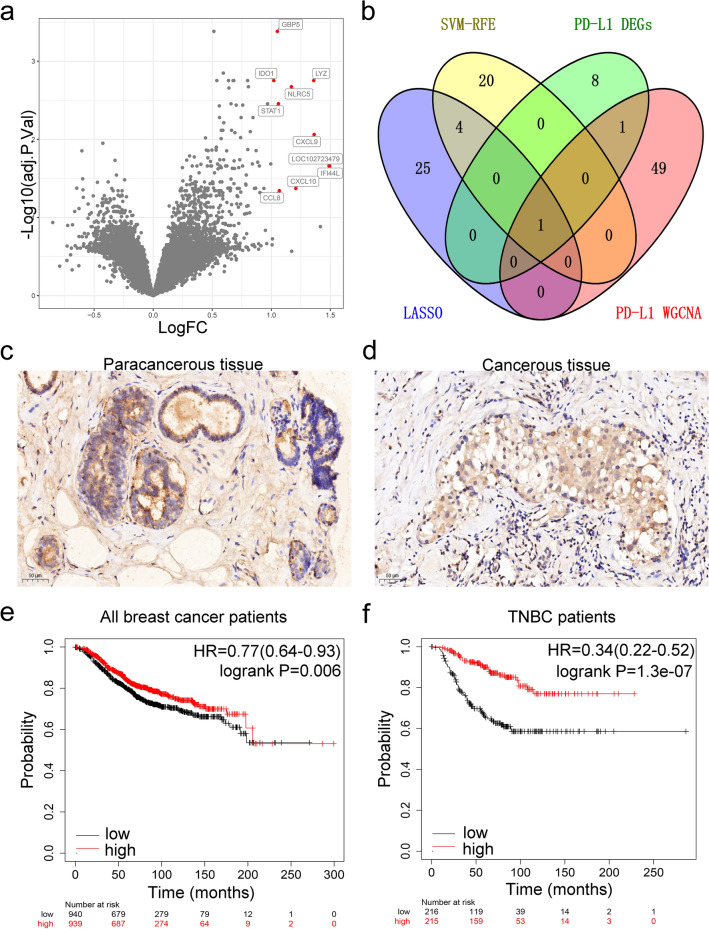
Fig. 6.
Overlapping genes and enrichment analysis. a Red dots indicate high expression of the DEGs in the GSE157284 volcano plot; b a Venn diagram showing overlapping genes between the PD-L1 expression status-DEGs, WGCNA-yellow genes, LASSO, and SVM; c and d expression of CXCL9 in TNBC para-cancerous and TNBC cancerous tissues determined with immunohistochemistry staining; e log-rank test with Kaplan–Meier survival curves was performed to compare overall survival (OS) between breast cancer patients with high and low CXCL9 expression; f log-rank test with Kaplan–Meier survival curves was performed to compare overall survival (OS) between TNBC patients with high and low CXCL9 expression groups

