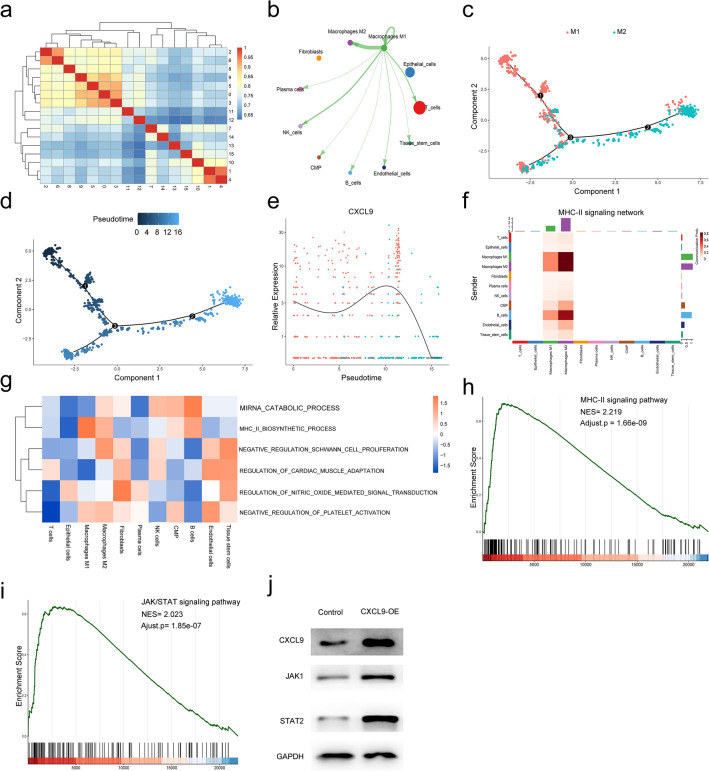
Fig. 8.
Cell cluster trajectory and CellChat analysis. a Heatmap of different cell clusters interaction correlation; b the cellular interaction weights of interactions between M1 macrophages and M2 macrophages; c the differentiation pseudotime trajectory of M1 macrophages and M2 macrophages; d pseudotime was colored in a gradient from dark blue to light blue; e the expression intensity of CXCL9 along the pseudotime axis; f the MHC-II signaling pathway network was significantly detected between the interactions of M1 macrophage and M2 macrophage; g differences in pathway activities scored by GSVA between all types of cell types; h and i GSEA analysis revealed a significant enrichment of MHC-II (hsa 04,514) and JAK/STAT signaling pathways. NES, normalized enrichment score; j CXCL9 was upregulated in the pENTER-CXCL9 group. JAK1 and STAT2 expressions were higher in the pENTER-CXCL9 group than in the control group

