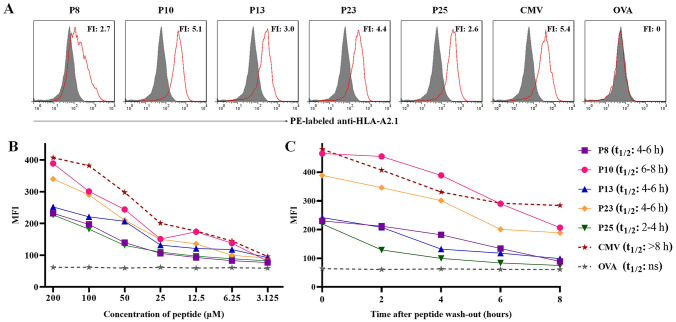
Fig. 4.
The five validated epitopes displayed high binding affinity with HLA-A0201 molecules onto T2 cells. a T2 cells were incubated with β2-m and each validate epitope peptide (200 μM) for 16 h, and followed by PE-labeled anti-HLA-A2.1 mAb staining as well as flow cytometry. Gray filled line represented the fluorescence strength of T2 cells under incubation with only β2-m, while the red solid line represented the fluorescence strength of T2 cells after co-incubation with β2-m and indicated peptides. CMV (CMVpp65495-503 epitope presented by HLA-A0201) and OVA (OVA257-264 epitope presented by H-2 Kb) were positive control and negative control peptides, respectively. The fluorescence index (FI) for each peptide was calculated and displayed. b T2 cells were incubated with each epitope peptide at 7 gradient concentrations and β2-m for 16 h followed by flow cytometry as described. The mean fluorescence intensities (MFI) of T2 cells at different concentrations of peptides were exhibited as dynamic curves. c T2 cells were incubated with β2-m and each epitope peptide (200 μM) for 16 h, then peptides were washed out and BFA/Monensin was added in each well for another incubation followed by flow cytometry as described. The MFI of T2 cells at different time points were exhibited as dynamic curves. The horizon of the half-life of each peptide dissociation from HLA-A0201 molecules (predicted t1/2) was calculated according to the MFI-Time curve and displayed also

