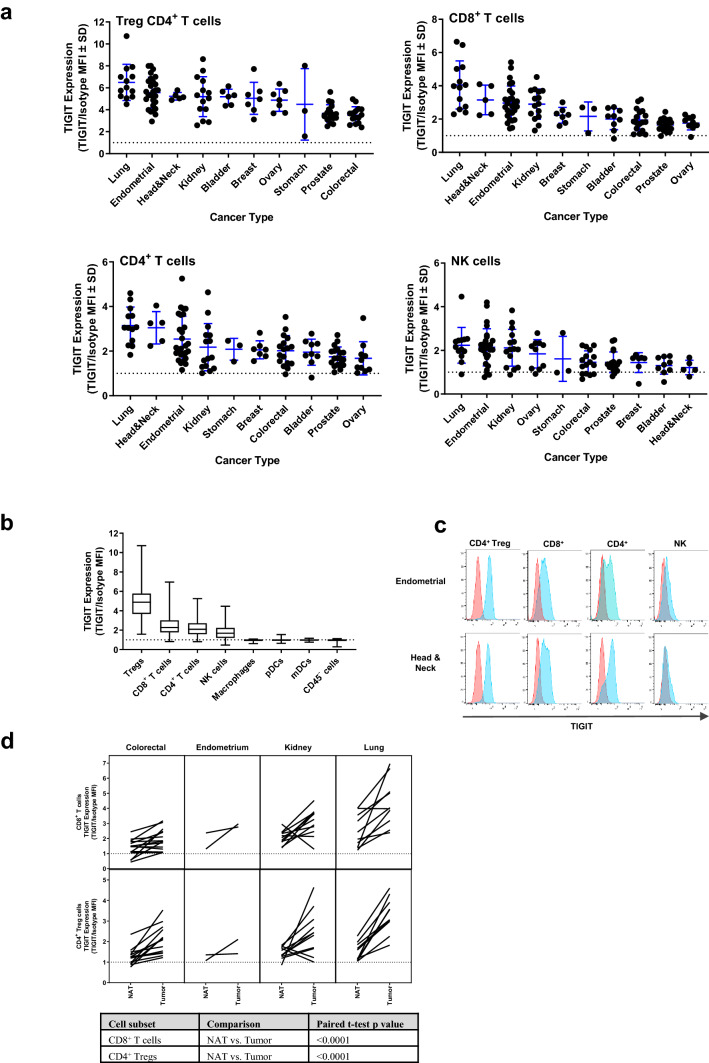
Fig. 1.
Expression of TIGIT on cells isolated from dissociated tumors and NATs. a TIGIT expression is shown on Treg CD4+ T, CD8+ T, non-Treg CD4+ T, and NK cells for each tumor type. Each dot within a column represents an individual sample. Mean ± SEM is presented. b Across all tumor samples examined, the expression of TIGIT on the different cell types is shown. The median is depicted by the middle line and the upper and lower quartiles are depicted by the boxes above and below the median line. The whiskers depict 1.5 times the interquartile range. c Representative histograms for TIGIT expression (blue) compared to an isotype control (red) are shown for four lymphocyte subsets isolated from an endometrial and a head and neck tumor. d Matched tumor and NAT samples were assessed for TIGIT expression on CD8+ T cells and CD4+ Tregs. Each line represents a matched donor

