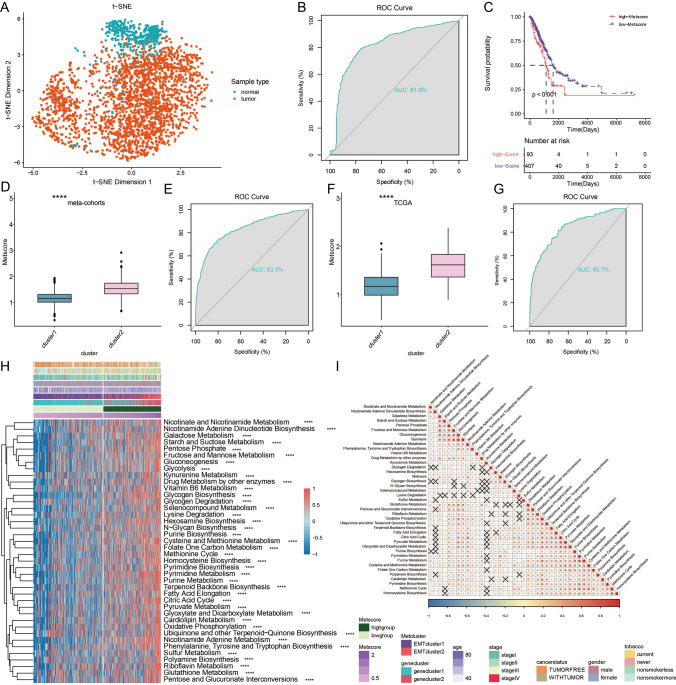
Fig. 5.
Construction of a Metscore. a t-distributed stochastic neighbor embedding (t-SNE) analysis based on Lasso genes clearly separated tumor and normal tissue. b ROC curve measuring the sensitivity of lasso genes in separating tumor and normal tissue. The area under the ROC curve was 0.819. c Kaplan–Meier curves showing the association between Metscore and OS of 500 patients in TCGA (log-rank test, P < 0.001). d Expression pattern of Metclusters in Metscore in meta-cohorts. e ROC curve measuring the consistency between Metscore and Metclusters in meta-cohorts. f Expression pattern of Metclusters in Metscore in TCGA. g ROC curve measuring the consistency between Metscore and Metclusters in TCGA. h Unsupervised clustering of metabolic related pathways for 500 patients in TCGA database. *P < 0.05; **P < 0.01; ***P < 0.001; ****P < 0.0001. i Correlation between Metscore and 40 known metabolic signatures

