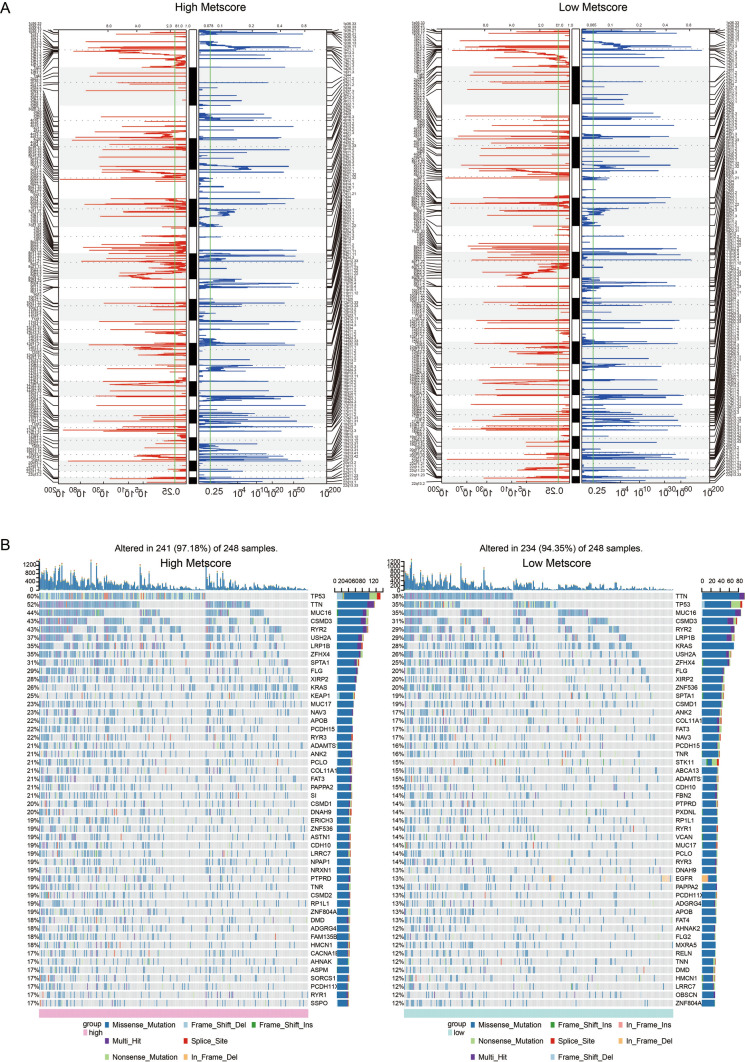
Fig. 6.
Distinct genomic profiles associated with Metscore. a GISTIC 2.0 amplifications and deletions in LUAD with high Metscore and low Metscore. Chromosomal locations of peaks corresponding to the significantly recurring focal amplification (red) and deletions (blue). b Differential somatic mutations in LUAD with low and high Metscores

