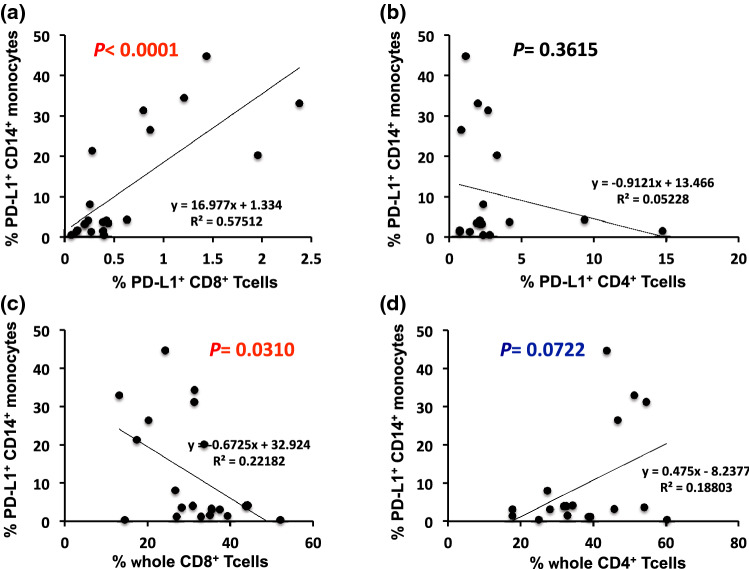
Fig. 5.
Linear correlation between PD-L1-expressing CD14+ monocytes and T cell subsets. Association between the percentage of peripheral PD-L1-expressing CD14+ monocytes and PD-L1-expressing a CD8+ T cells or b CD4+ T cells, and peripheral PD-L1-expressing CD14+ monocytes and whole c CD8+ T cells or d CD4+ T cells. Each dot represents one specimen from a total of 21 or 18 patients

