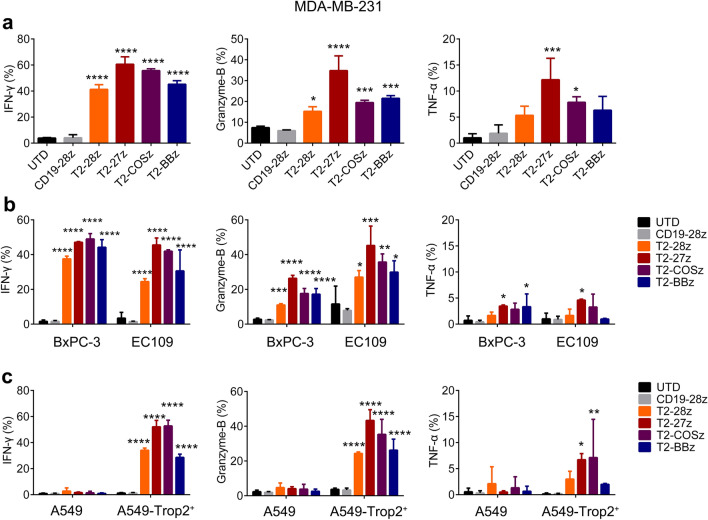
Fig. 2.
Cytokines produced by T2-CAR T cells. Cytokines released by a variety of T2-CAR T cells when co-cultured with MDA-MB-231 cells (a), BxPC-3 and EC109 cells (b), or A549/A549-Trop2+ cells (c) were analyzed. All data are displayed as a mean ± SEM (n = 3), with differences determined relative to the CD19-28z group (one-way ANOVA with Dunnett’s test). *p < 0.05, **p < 0.01, ***p < 0.001, ****p < 0.0001

