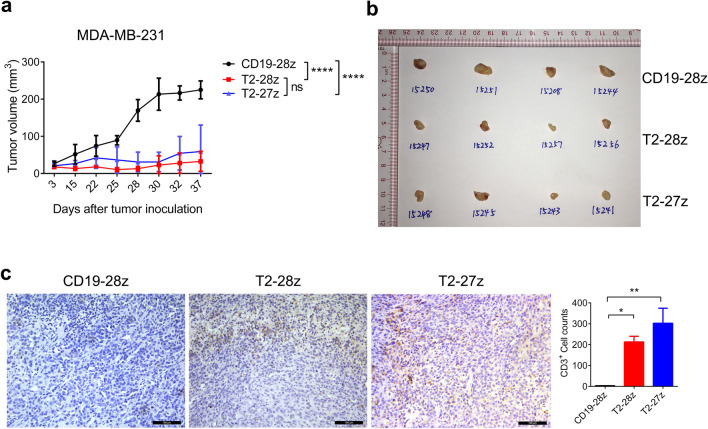
Fig. 3.
Antitumor activities of T2-CAR T cells in a tumor-bearing NCG mouse model. a Tumor size was measured by digital calipers. b Tumor tissues were examined at 37 days postinoculation. c CAR T cells were detected by immunohistochemical staining with anti-human CD3 Ab (shown in brown), scale bar = 100 μm. All data are presented as mean ± SEM (N = 4 mice/group (two-way ANOVA)). *p < 0.05, **p < 0.01, ***p < 0.001, ****p < 0.0001

