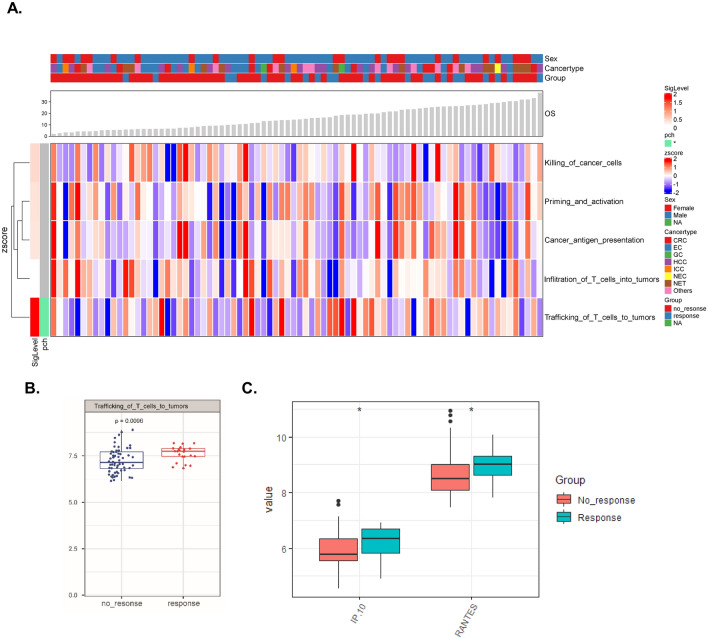
Fig. 2.
Functional characterization of cytokine signatures in the discovery cohort. a Complex heatmap demonstrating the pattern of different functional cytokine signatures in the response and nonresponse subgroups (the definition of functional cytokine signatures was summarized in Table S1). b Levels of the “trafficking of T-cells into the tumor signature” in both subgroups. c The value (log2 transformed) of each cytokine belonging to the “trafficking of T-cells into the tumor signature” in both subgroups was compared. *P < 0.05

