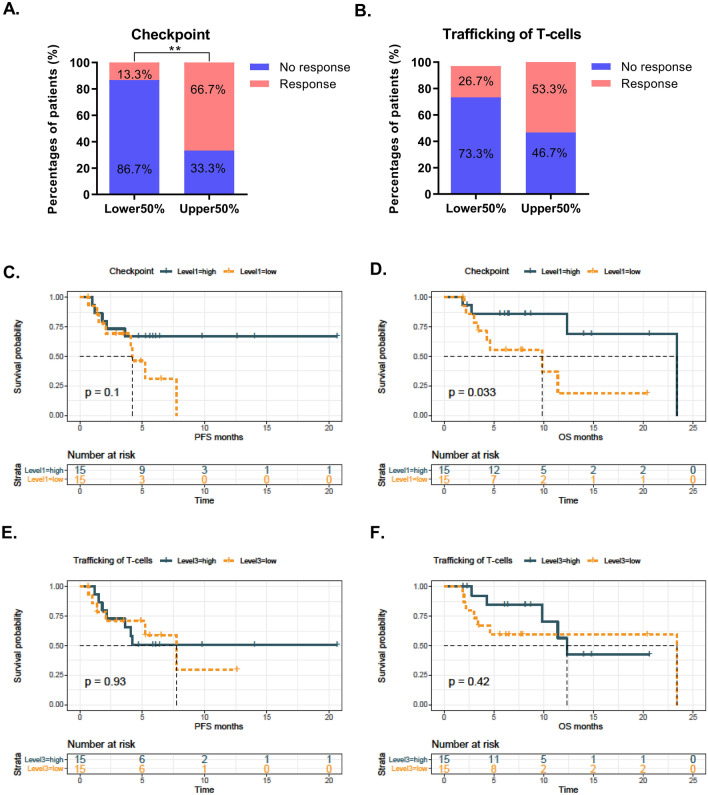
Fig. 5.
Predictive and prognostic values of cytokine signatures in the validation cohort. a Overall response rate (ORR) in the “checkpoint signature”-high and -low subgroups. b ORR in the “trafficking of T-cell signature”-high and -low subgroups. c, d KM survival analysis was used to compare PFS (C) and OS (D) in the “checkpoint signature”-high and -low subgroups when using the median value as the cutoff point e, f. KM survival analysis was used to compare PFS (E) and OS (F) in the “trafficking of T-cells into the tumor signature”-high and -low subgroups when using the median value as the cutoff point. **P < 0.01

