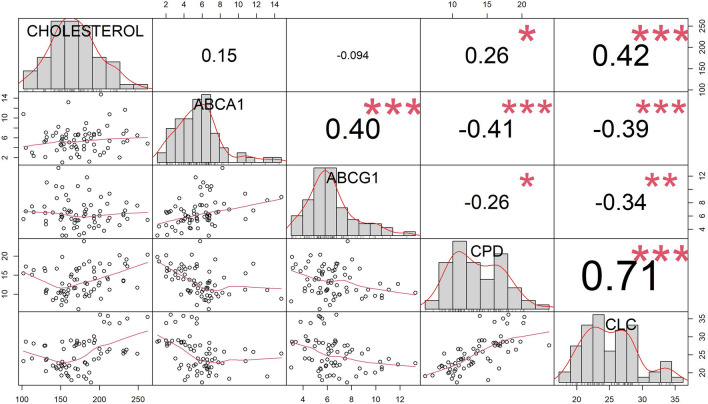
Fig. 1.
Correlation matrix about the distributions (on the diagonal line) and correlations (as scatter plots and Pearson’s correlation values in lower and upper triangle, respectively) among the variables of interest (level of plasmatic cholesterol, serum ABCA-1 and ABCG-1-mediated CEC, PD and CLC). ABCA-1 = ATP-binding cassette transporter A1; ABCG1 = ATP-binding cassette transporter G1; CEC = cholesterol efflux capacity; CPD = cholesterol passive diffusion; CLC = cholesterol loading capacity

