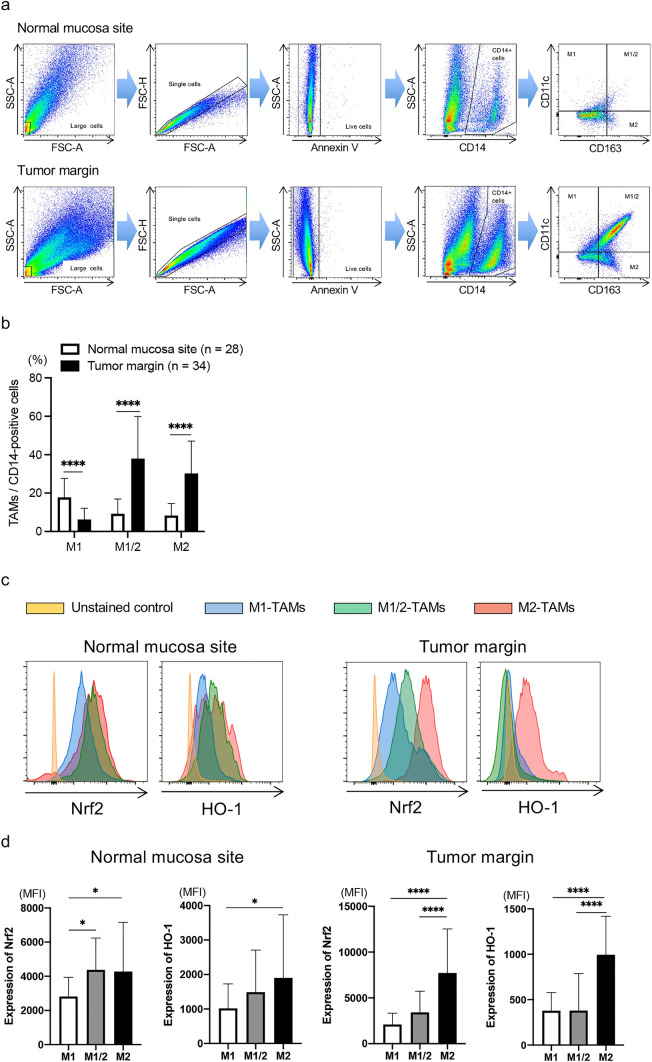
Fig. 2.
Expression level of antioxidants in M2-TAMs. The frequency of TAMs and expression level of Nrf2 and HO-1 in TAMs were evaluated by flow cytometry. a The gating method to detect TAMs. b The summarized data of frequency of M1-, M1/M2-, and M2-TAMs infiltration in the normal mucosa site (n = 28) and tumor margin (n = 34). c Representative histograms of Nrf2 and HO-1 expressions in TAMs in the normal mucosa site (left) and tumor margin (right). d The summarized data of these expression levels in M1-, M1/M2-, and M2-TAMs in the normal mucosa site (left, n = 28) and tumor margin (right, n = 34). *p < 0.05, ****p < 0.0001

