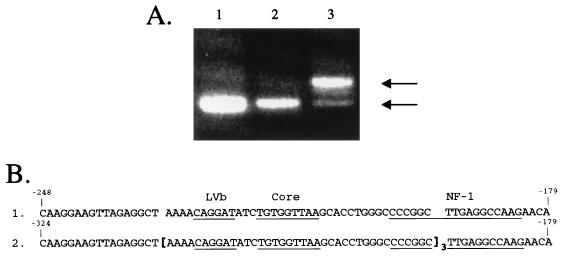
FIG. 5.
Analysis of the exogenous LTR U3 region in tumor specimens from FRA-infected cats. (A) PCR amplifying a 300-bp region from the DNA of two thymic tumors. Lanes: 1, pFRA as control; 2, tumor from cat 5024; 3, tumor from cat 5025. The upper arrow indicates the larger product, whereas the lower arrow indicates the normal-sized product. (B) Sequences encompassing the region of triplication are compared between FRA (lane 1) and tumor DNA from cat 5025 (lane 2). The triplicate sequence is shown within the brackets. Structural motifs are underlined and identified above the FRA sequence. Numbers at the ends of the sequences mark the relative distance from the CAP site.

