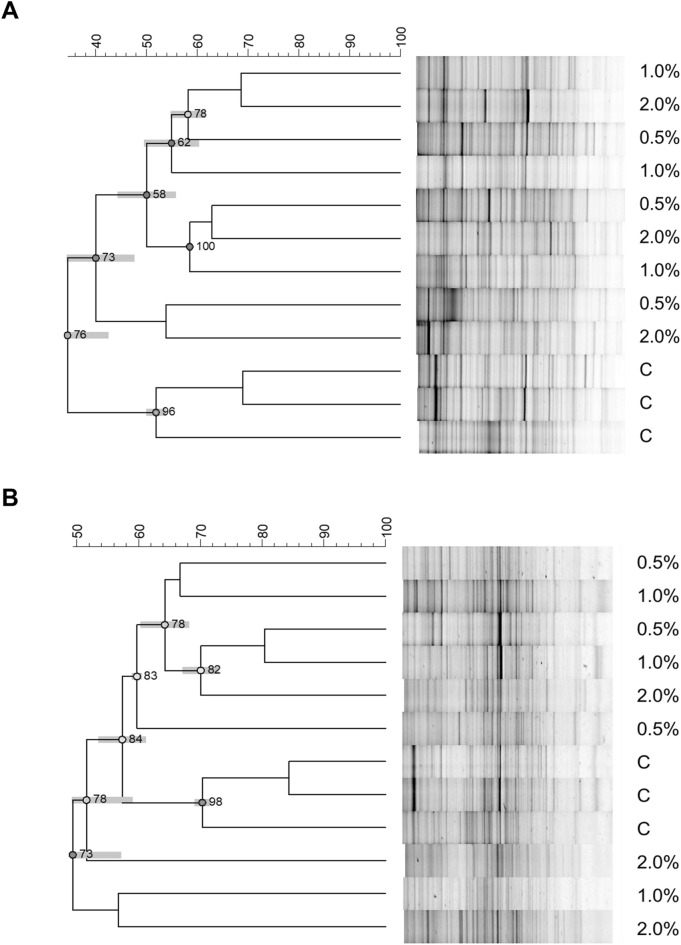
Fig. 2.
Cluster analyses of bacterial DGGE profiles. Dendrograms obtained by UPGMA (Unweighted Pair Group Method Using Arithmetic Average) analysis, using Pearson’s coefficient, based on bacterial DGGE profiles obtained from pot-grown olive trees fertilized with two types of sheep wool residues (SWR). A white wool, WW, and B black wool, BW, used at 4 different SWR/soil percentages: 0 (C), 0.5, 1.0, 2.0%. Cophenetic correlation is shown at each node by numbers and coloured dots, ranging between green–yellow–orange–red, according to decreasing values. Standard deviation is shown at each node by a grey bar

