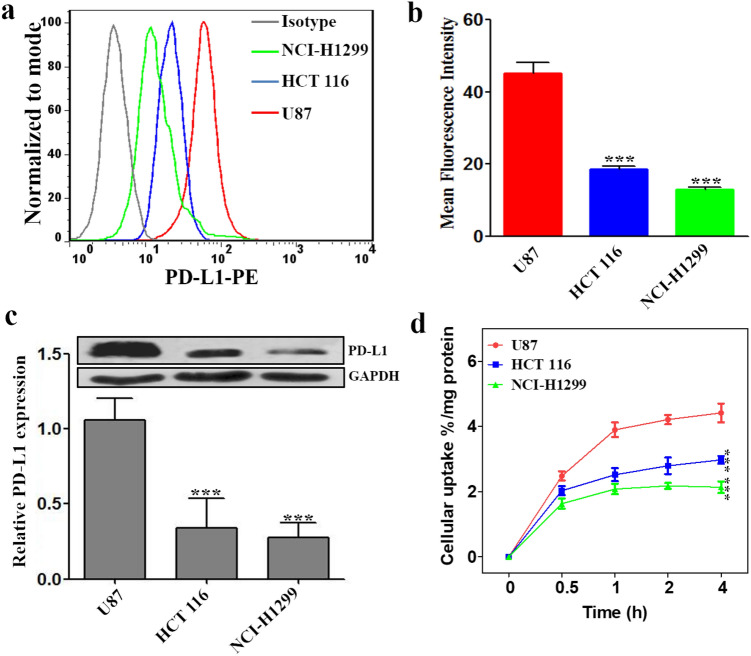
Fig. 1.
Analysis of PD-L1 expression in different cancer cell lines. a Flow cytometry analysis of PD-L1 expression in different cancer cells (U87, HCT 116, and NCI-H1299). b Quantitative analysis of mean fluorescence intensity using FlowJ. c Western blot analysis of PD-L1 (50 kDa) expression in cancer cells with GAPDH (36 kDa) as the internal control. d Cellular uptake of 68Ga-NOTA-Nb109 in cancer cells of U87, HCT 116, and NCI-H1299. All results were expressed as mean ± SD from three independent experiments. ***P < 0.001

