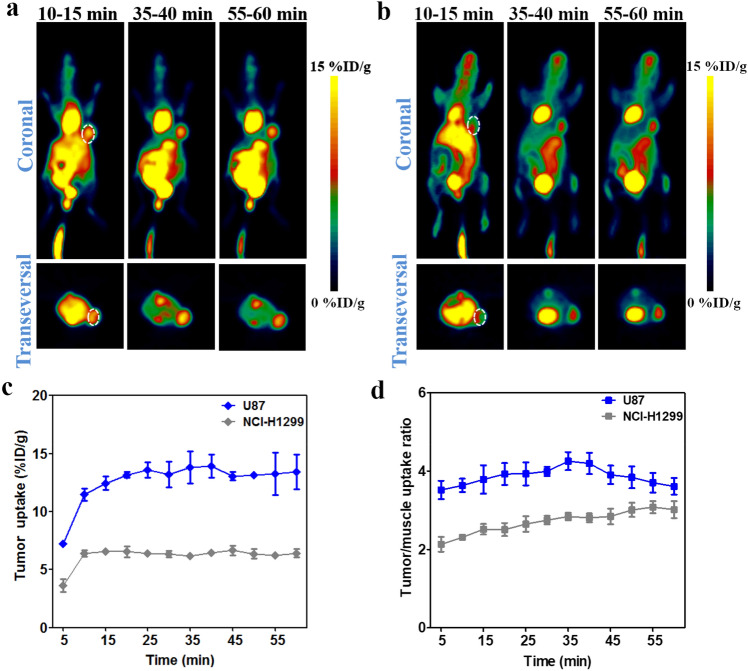
Fig. 8.
MicroPET imaging of tumor-bearing models with 18F-FDG. a Representative PET images of U87 xenograft obtained at different time points after injection of 18F-FDG. b Representative PET images of NCI-H1299 xenograft obtained at different time points after injection of 18F-FDG. The tumor was denoted with a dotted line circle. c Tumor uptake of 18F-FDG in U87 and NCI-H1299 xenografts quantified by region of interest (ROI) analysis over the imaging time-course. d Tumor-to-muscle uptake ratio for 18F-FDG in U87 and NCI-H1299 xenografts over time. All data were expressed as mean ± SD (n = 3)

