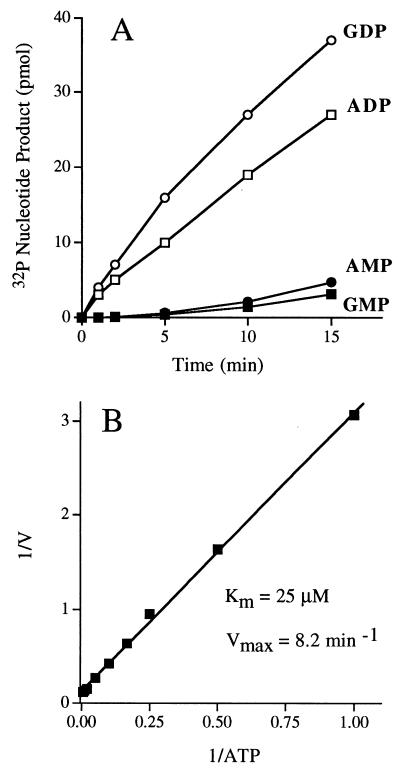
FIG. 7.
Characterization of the NTPase activity of the 2.5S phosphatase. (A) ATP and GTP hydrolysis. Reaction mixtures containing (per 10 μl) 10 μM [α-32P]ATP or [α-32P]GTP and 1 pmol of 23-kDa protein from glycerol gradient fraction 16 were incubated at 30°C. Aliquots (10 μl) were withdrawn at the times specified and quenched immediately by mixing with 1 μl of 1 M formic acid. The reaction products were analyzed by PEI-cellulose TLC. The extents of ADP or GDP formation and AMP or GMP formation are plotted as function of reaction time. (B) Steady-state kinetic parameters of ATP hydrolysis. Reaction mixtures (10 μl) containing 1 pmol of 23-kDa protein from glycerol gradient fraction 16 and either 1, 2, 4, 6, 10, 20, 50, 100, or 200 μM [α32P]ATP were incubated at 30°C for 15 min. The extent of ADP formation (in picomoles) was determined by TLC analysis of the reaction products. A double-reciprocal plot of the rate of ADP formation (min−1 = pmol of ADP formed/15) versus [ATP] is shown.

