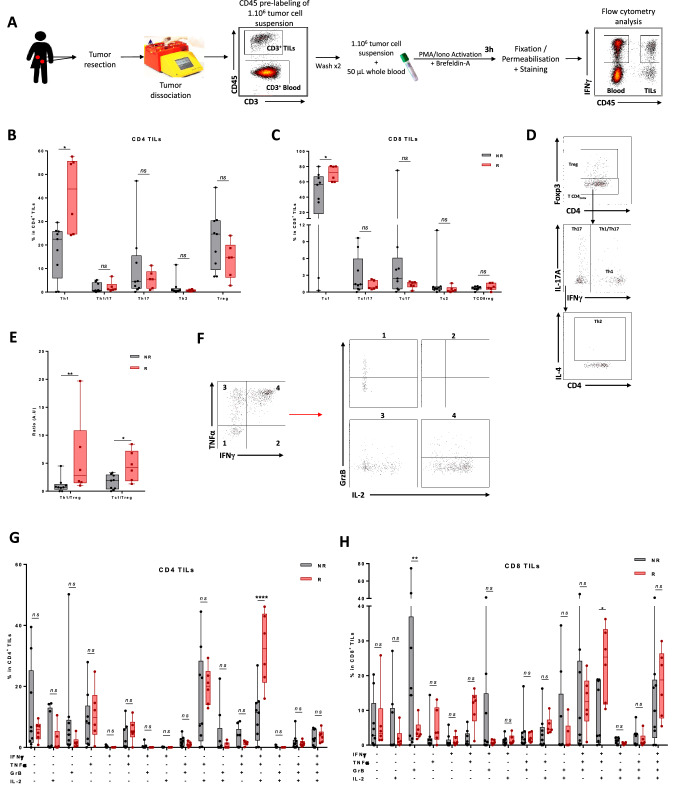
Fig. 2.
Association between baseline lymphoid cell number and response to combo-immunotherapy. A Fresh tumor tissues and associated blood samples for each patient (n = 16) were activated, stained and then analysed by flow cytometry. B The frequency of Th1 (CD4+ Foxp3− IFNγ+ IL-17A−), Th17 (CD4+ Foxp3− IFNγ− IL-17A+), Th1-Th17 (CD4+ Foxp3− IFNγ+ IL-17A+), Th2 (CD4+ Foxp3− IFNγ− IL-17A− IL-4+) and Treg (CD4+ Foxp3+) cells in CD4+ TILs (CD45+ CD3+ CD4+) according to responder versus non-responder status is depicted. C The frequency of Tc1 (CD8+ Foxp3− IFNγ+ IL-17A−), Tc17 (CD8+ Foxp3− IFNγ− IL-17A+), Tc1-Tc17 (CD8+ Foxp3− IFNγ+ IL-17A+), Tc2 (CD8+ Foxp3− IFNγ− IL-17A− IL-4+) and T CD8reg (CD8+ Foxp3+) cells in CD8+ TILs (CD45+ CD3+ CD8+) according to responder (R) versus non-responder (NR) status is depicted. D Representative dot plots of helper T and CD8 T subtype function analysis shown in B and C. E The Th1-Treg and Tc1-Treg ratio is plotted against responder (R) and non-responder (NR) status. F Representative dot plots of CD4 T and CD8 T function analysis shown in G and H. G, H Box plots showing the different combinations of expression of the 4 cytokines IFNγ, TNFα, Granzyme B (GrB) and IL-2 in CD4 (CD45+ CD3+ CD4+) (G) and CD8 (CD45+ CD3+ CD8+) (H) TILs according to responder (R) versus non-responder (NR) status. Statistical difference was determined by a Mann–Whitney test. ns not significant, *p < 0.05, **p < 0.01, ***p < 0.001, ****p < 0.0001

