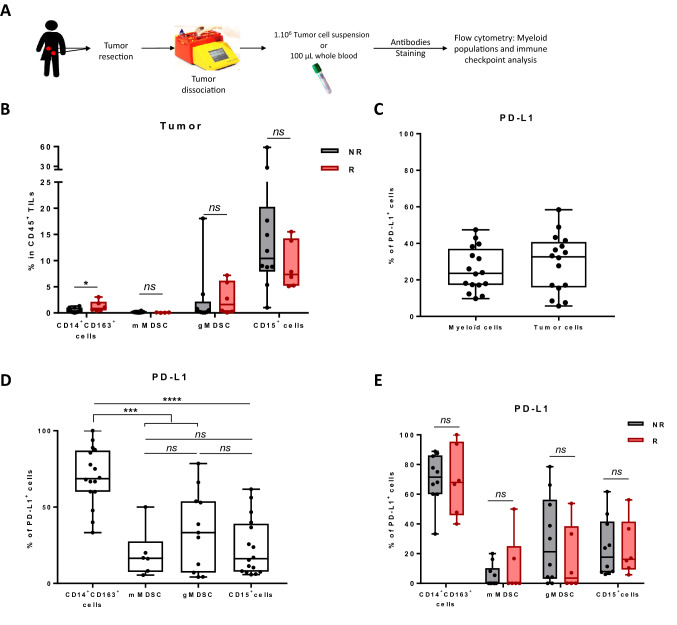
Fig. 4.
Association between baseline myeloid cell number and response to combo-immunotherapy. A Fresh tumor tissues and associated blood samples for each patient (n = 16) were stained and then analysed by flow cytometry. B The frequency of macrophages (CD14+ CD163+), mMDSC (CD14+ CD163− HLA-DRlow), gMDSC (CD15+ CD14+) and granulocytes (CD15+) in tumor samples according to responder (R) or non-responder (NR) status is depicted. C Box plots showing PD-L1 expression on myeloid (CD11b+) and tumor cells. D Box plots showing PDL1 expression on different myeloid subtypes (macrophages (CD14+ CD163+), mMDSC (CD14+ CD163− HLA-DRlow), gMDSC (CD15+ CD14+) and granulocytes (CD15+)) in tumor samples. E Box plots showing PDL1 expression on different myeloid subtypes (macrophages (CD14+ CD163+), mMDSC (CD14+ CD163− HLA-DRlow), gMDSC (CD15+ CD14+) and granulocytes (CD15+)) in tumor samples according to responder (R) or non-responder (NR) status. Statistical difference was determined by a Mann–Whitney test. ns not significant, *p < 0.05, **p < 0.01, ***p < 0.001, ****p < 0.0001

