Fig. 5.
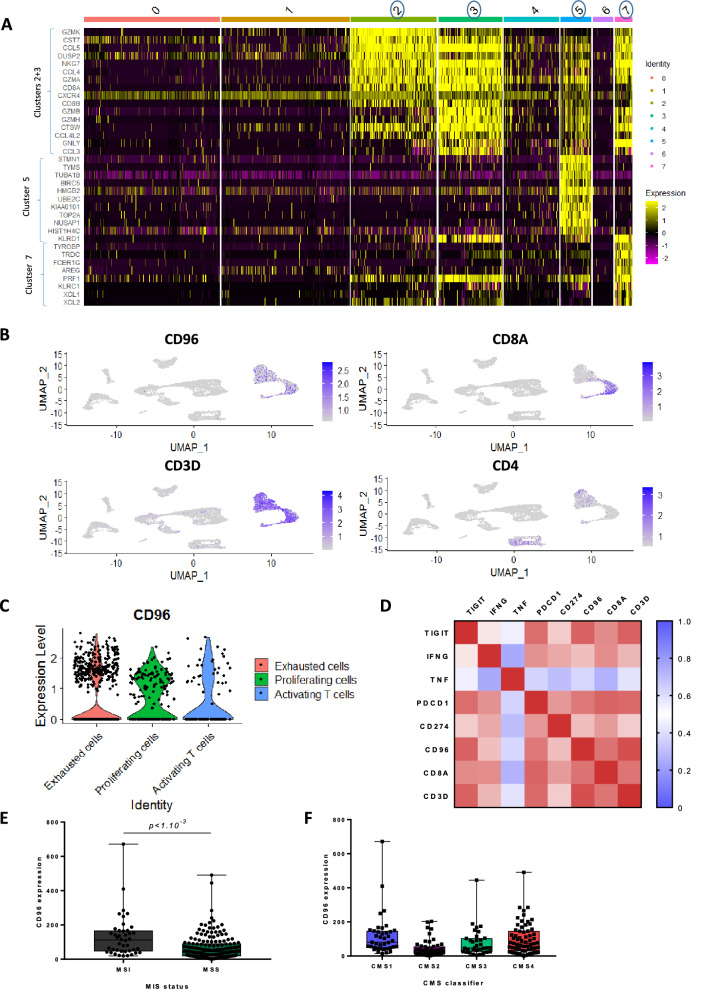
CD96 expression in lymphoid cells characterized a particular CRC subtype. A Heatmap representing gene expression matrix among the 7 clusters of cells expressing CD96, IFNG, TNF, PDCD1, CD274, HAVCR2, CD101, SLAMF6, TCF7. Gene expression levels are represented by colors. Only genes most characteristics of each cluster were kept for visualization. B Umap visualization of cells from tumor data from 5 patients with colorectal cancer analysed using single cell RNAseq. Each dot corresponds to a single cell. The 4 panels respectively highlight expression of CD96, CD8A, CD3D and CD4 genes among clusters. C Violin plots showing expression level of CD96 in exhausted, proliferating and activated T cell clusters based on single cell RNAseq analysis. D RNAseq expression correlation matrix involving genes used for the metagene estimation, namely TIGIT, IFNG, TNF, PDCD1, CD274, CD8A, CD3D, and CD96. E, F Boxplots showing the RNAseq expression of CD96 given the MSI status (E) and the CMS classification (F)

