Fig. 5.
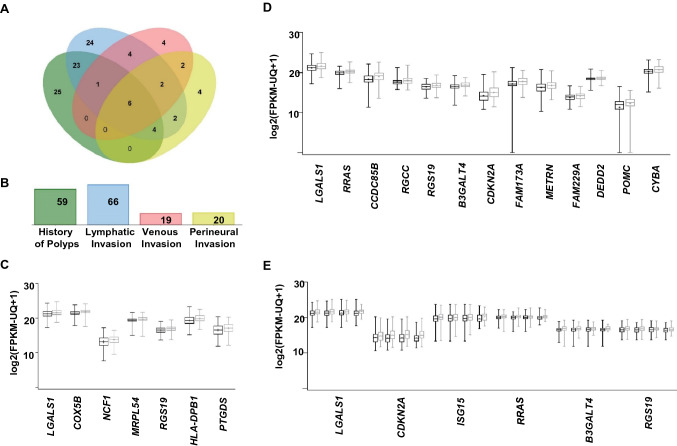
Gene overlaps among different clinical parameters associated with colorectal cancer. Venn diagram showing the overlaps between genes from the selected significantly upregulated genes (Welch's t test P < 0.05) in TCGA colon cancer patients with clinical parameters; history of polyps, lymphatic invasion, venous invasion or perineural invasion a. The number of shared genes among CRC clinical parameters is shown in the Venn diagram. Bar plots showing the number of the significantly upregulated genes associated with each CRC clinical parameter b. Box and whiskers plots showing the expression of most significant upregulated genes associated with history of polyps (n = 7, Welch's t test P value < 0.001) c and lymphatic invasion (n = 13, Welch's t test P value < 0.0001) d. Box and whiskers plot showing the expression of the overlapped genes (n = 6), which were significantly upregulated in GDC TCGA colon cancer patients with history of polyps, lymphatic invasion, perineural invasion or venous invasion e. The log2 (FPKM-UQ + 1) dataset was accessed via the UCSC Xena platform (http://xena.ucsc.edu/). Gray color indicates “presence of the phenotype,” and black color indicates the absence of the phenotype c–e

