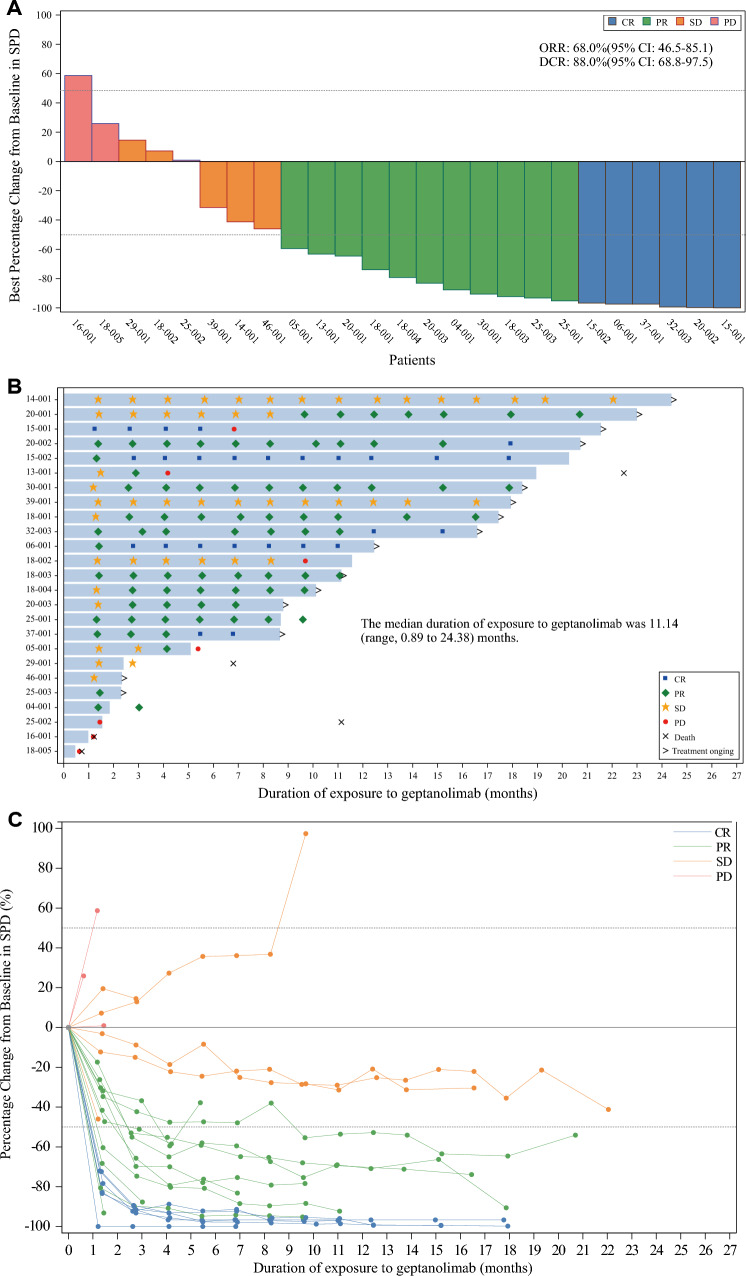
Fig. 2.
A Waterfall plot of best percentage change from baseline in SPD for the FAS assessed per the IRC (N = 25); B Duration of exposure to geptanolimab, time to response and duration of response for patients in the FAS assessed per the IRC (N = 25); C Spdier plot for IRC-assessed percentage change from baseline in SPD at different time points. In figure A and C, dotted line at − 50% represents PR at 50% reduction in SPD, and dotted line at 50% indicates PD at 50% increase in SPD as determined on the basis of Lugano Classification 2014. SPD sum of the product of the perpendicular diameters for multiple lesions; CR complete response; PR partial response; PD progressive disease; SD stable disease; IRC independent review committee; FAS full analysis set

