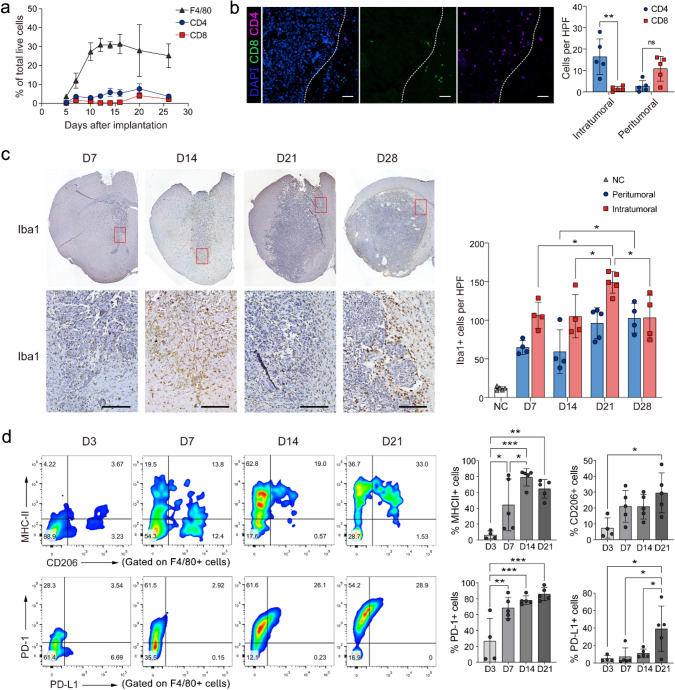
Fig.1.
GAMs are dominant tumor-infiltrating immune cells in the glioma progression. a The line graph shows the dynamic changes of F4/80+ GAMs, CD4+, and CD8+ T cells in glioma progression, as accessed by FACS. b Representative immunofluorescence staining images for CD8+ T cells (green), CD4+ T cells (pink), and DAPI (blue) in the tumor area (scale: 100 μm). The average number of CD8+ and CD4+ T cells in each HPF (400×) was calculated in the right figure (n = 5). Each mouse was counted from 3 to 5 random HPF. c The representative IHC images for Iba1+ cells in the tumor area on days 7, 14, 21, and 28 after tumor inoculation (scale: 100 μm). The statistical analysis results are shown in the right panel. Ctrl: contralateral brain, Peritumoral: peritumoral area, defined as 100 μm from the tumor boundary, Intratumoral: intratumoral area. n = 4–5. d The phenotype of GAMs was analyzed by FACS on days 3, 7, 14, and 21 after tumor inoculation (n = 4–5). *P < 0.05, **P < 0.01, ***P < 0.001

